. 2018 Jul 6;46(12):6009-6025.
doi: 10.1093/nar/gky342.

Antisense transcriptional interference mediates condition-specific gene repression in budding yeast

Affiliations

Antisense transcriptional interference mediates condition-specific gene repression in budding yeast

Alicia Nevers et al. Nucleic Acids Res. .

Abstract

Pervasive transcription generates many unstable non-coding transcripts in budding yeast. The transcription of such noncoding RNAs, in particular antisense RNAs (asRNAs), has been shown in a few examples to repress the expression of the associated mRNAs. Yet, such mechanism is not known to commonly contribute to the regulation of a given class of genes. Using a mutant context that stabilized pervasive transcripts, we observed that the least expressed mRNAs during the exponential phase were associated with high levels of asRNAs. These asRNAs also overlapped their corresponding gene promoters with a much higher frequency than average. Interrupting antisense transcription of a subset of genes corresponding to quiescence-enriched mRNAs restored their expression. The underlying mechanism acts in cis and involves several chromatin modifiers. Our results convey that transcription interference represses up to 30% of the 590 least expressed genes, which includes 163 genes with quiescence-enriched mRNAs. We also found that pervasive transcripts constitute a higher fraction of the transcriptome in quiescence relative to the exponential phase, consistent with gene expression itself playing an important role to suppress pervasive transcription. Accordingly, the HIS1 asRNA, normally only present in quiescence, is expressed in exponential phase upon HIS1 mRNA transcription interruption.


Figures
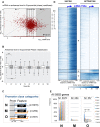
Figure 1.
Figure 1.
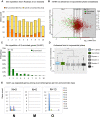
Antisense ncRNAs are over-represented in lowly expressed genes. (A) Scatter plot representing the antisense level (ordinate) function of the corresponding mRNA level (abscissa) in log10 read/base in an upf1Δ background. Average read counts per nucleotides were determined for each 5892 genes, and divided into ten bins (grey strips) of equal length (N = 589 genes per bin for bin1 to bin9; N = 591 genes for bin10). The Pearson correlation coefficient R2 = 0.07. (B) Comparison of the average antisense level distribution between bins. Boxplots show the distribution of the average antisense levels within each bin. Brackets indicate the results of an Anova test on pairs of distributions, with ***P < 0.001. (C) Schematic of the gene-associated promoter class categories depending of the presence and the characteristics of asRNA: N = No asRNA, M = asRNA within the mRNA, O = TSS-overlapping asRNA. An arbitrary threshold of at least three RNA sequencing reads per nucleotide, in a +1 to +200 nucleotide window relative to the mRNA TSS position, was used to define the presence of an asRNA. (D) Heatmap distribution of mRNA (left) and antisense (right) around the mRNA TSS of all genes (from position −200 to +200 relative to the mRNA TSS), sorted by antisense and promoter class categories. Depending of the class of promoter defined in C, a category N, M or O was assigned to each gene. (E) Promoter class categories count per bin. The total number of genes that belong to each class of promoter is indicated (class N: N = 5076; class M: N = 259; class O: N = 557). Bar charts represent the percentage of each class within the 10 bins defined in A (see also Dataset 1). Brackets indicate the results of a statistical inference test on pairs of distributions between bin1 and each other bins, with ***P < 0.001.
Figure 2.
Figure 2.
Promoter overlapping antisenses are overrepresented in set2Δ targets. (A) Gene distribution across promoter categories in set2Δ up-regulated genes (dataset from 13). Stacked histograms represent the proportion of set2Δ up-regulated genes across all genes (All), or depending on the presence of a TSS-overlapping asRNA (‘+’ = class O) or not (‘–‘ = classes N + M). Brackets indicate the results of a statistical inference test on pairs of distributions, with *P < 0.05, and ***P < 0.001. (B) Set2Δ up-regulated genes count depending the presence of a TSS-overlapping asRNA or not and per bin. Brackets indicate the results of a statistical inference test on pairs of distributions between bin1 and each other bins, with ***P < 0.001.
Figure 3.
Figure 3.
Quiescent-enriched genes are associated with high antisense level. (A) Bar plot of stationary phase-enriched genes count (SP-enriched) versus other genes count (not SP-enriched) within each bin (dataset from 49). (B) Distribution of quiescence-enriched genes among the 5892 yeast genes. Scatter plot of the antisense level as a function of the corresponding mRNA level. 261 genes were found enriched at least 5 times between exponential and quiescence, defining the quiescence-enriched genes (Q-enriched, green dots, see also Dataset 1 and Materials and Methods). (C) Bar chart of the 261 Q-enriched genes within the 10 bins. (D) Distributions of antisense level for different gene categories in exponential phase. Boxplots show the mean antisense level of 261 corresponding Q-enriched genes (green) or ‘Random’ (gray) genes. Random-1, -2 and -3 were defined by random sampling of 261 genes among all the 5892 genes. ‘Bin_1’ (blue) or ‘All’ categories (black) are the measures of all 589 genes from bin1 or all 5892 genes respectively. Brackets indicate the results of an Anova test on pairs, with *P < 0.05, and ***P < 0.001. (E) set2Δ up-regulated genes count among Q-enriched genes per promoter class and bin. The bar charts represent the count of set2Δ up-regulated genes within each category of promoter and each bin (see also Dataset 1). The total number of genes that belong to each promoter class is indicated (N).
Figure 4.
Figure 4.
Quiescence-enriched genes mRNA and corresponding asRNAs are anti-regulated. Northern-Blot probing for time course mRNA and antisense transcripts in a Δupf1 strain for five examples of Q-enriched genes: PET10, SHH3, MOH1, CLD1 and ARO10. Time point 0’ is the time at which quiescent-arrested cells are restarted in rich YPD medium. SCR1 is used as a loading control. RNA probes are described in Supplementary Figure S1 and Supplementary Table S2.
Figure 5.
Figure 5.
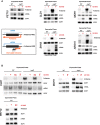
Antisense transcription interruption during the exponential growth relieves repression of quiescence-enriched genes. (A) Northern blot probing for the PET10, CLD1, MOH1, SHH3 and ARO10 mRNA and antisense transcripts in the WT and Δupf1 strains with (+) or without (–) the insertion of an antisense Nrd1-Nab3-Sen1 terminator (AS NNS). SCR1 is used as a loading control. RNA probes and NNS insertion are described in Supplementary Figure S1 and Supplementary Table S2 (see also Materials and Methods for strain construction and AS NNS-corresponding strains in Supplementary Table S1). (B) Northern blot probing for the PET10, CLD1, and MOH1 mRNA and antisense transcripts with scrambled (‘sc’) NNS controls (corresponding to a scrambled NNS sequence resulting in a non functional NNS terminator for PET10 and CLD1) and/or in frame (‘if’) NNS insertion in order to maintain the frame in the open reading frame on the opposite strand of the NNS terminator for CLD1 and MOH1) (see also Materials and Methods).
Figure 6.
Figure 6.
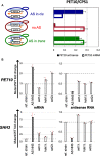
Antisense repression is mediated by transcriptional interference mechanisms. (A) Strand-specific RT-qPCR analysis of PET10 mRNA and antisense RNA abundance in diploid strains. PET10 antisense is transcribed in cis (blue), in trans (green) or not produced (red). The triangles symbolise the insertion of the NNS signal, in orange for the NNS signal specific to the asRNA, in green for the mRNA. (B) Strand-specific RT-qPCR analysis analysis of PET10 (upper panel) and SHH3 (lower panel) mRNAs and antisense abundances in a mutant strain where the deletion of UPF1 (ref. strain) is either combined to an antisense-specific NNS terminator insertion (AS NNS, dashed; positive control), or to the deletion of a chromatin modification factor (set1Δ, hda1Δ and set2Δ).
Figure 7.
Figure 7.
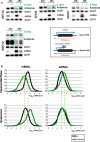
Gene expression is repressive for antisense non-coding transcription. (A) Northern blot analysis of PET10, MOH1, SHH3 and ARO10 mRNA and antisense RNAs in Δupf1 strain, after 24 h or 48 h of growth in YPD and with (+) or without (–) the insertion of a sense Nrd1-Nab3-Sen1 terminator (NNS S). RNA probes and NNS insertion are described in Supplementary Figure S4 and Supplementary Table S2 (see also Material and Methods for strain construction) and NNS S -corresponding strains in Supplementary Table S1. SCR1 is used as a loading control. (B) Comparison of density plots between all (black lines) and Q-enriched genes (green lines) for mRNAs (left panels) or associated asRNA (right panels) from cultures harvested in exponential (upper panels) or G0 (lower panels) phases. Log10 RNA levels are plotted (abscissa) function of the frequency (ordinate).
Figure 8.
Figure 8.
HIS1 associated asRNA is induced in quiescence or when HIS1 mRNA transcription is interrupted. (A, B) Northern blot analysis of HIS1 mRNA and antisense RNAs in WT and Δupf1 strains in exponential phase or quiescence (A) or in exponential phase with (+) or without (–) the insertion of a sense Nrd1-Nab3-Sen1 terminator (NNS S; B). RNA probes and NNS insertion are described in Supplementary Figure S1 and Supplementary Table S2 (see also Materials and Methods for strain construction) and NNS S-corresponding strains in Supplementary Table S1. SCR1 is used as a loading control.

References

    1. Carninci P., Hayashizaki Y.. Noncoding RNA transcription beyond annotated genes. Curr. Opin. Genet. Dev. 2007; 17:139–144. - PubMed
    1. Goffeau A., Barrell B.G., Bussey H., Davis R.W., Dujon B., Feldmann H., Galibert F., Hoheisel J.D., Jacq C., Johnston M. et al. . Life with 6000 genes. Science. 1996; 274:563–567. - PubMed
    1. David L., Huber W., Granovskaia M., Toedling J., Palm C.J., Bofkin L., Jones T., Davis R.W., Steinmetz L.M.. A high-resolution map of transcription in the yeast genome. Proc. Natl. Acad. Sci. U.S.A. 2006; 103:5320–5325. - PMC - PubMed
    1. Xu Z., Wei W., Gagneur J., Perocchi F., Clauder-Münster S., Camblong J., Guffanti E., Stutz F., Huber W., Steinmetz L.M.. Bidirectional promoters generate pervasive transcription in yeast. Nature. 2009; 457:1033–1037. - PMC - PubMed
    1. Jensen T.H., Jacquier A., Libri D.. Dealing with pervasive transcription. Mol. Cell. 2013; 52:473–484. - PubMed

Publication types

MeSH terms