. 2018 Jun 28;131(26):2915-2928.
doi: 10.1182/blood-2018-03-838540. Epub 2018 May 22.

Reactivation of γ-globin in adult β-YAC mice after ex vivo and in vivo hematopoietic stem cell genome editing

Affiliations

Reactivation of γ-globin in adult β-YAC mice after ex vivo and in vivo hematopoietic stem cell genome editing

Chang Li et al. Blood. .

Abstract

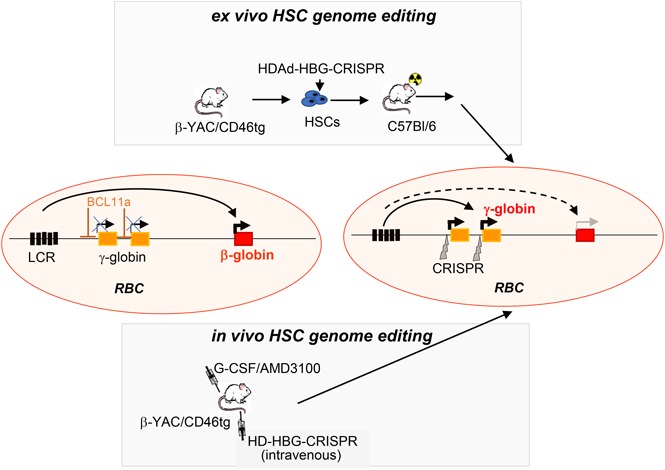
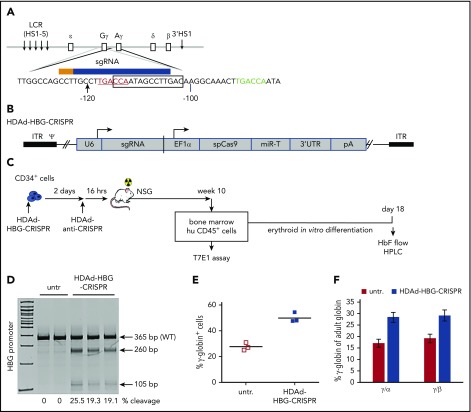
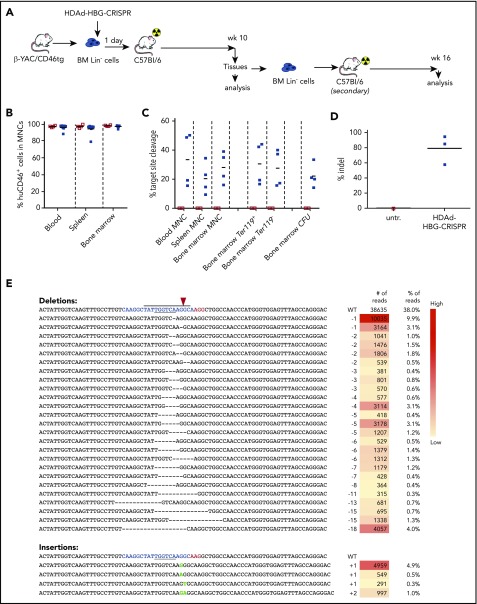
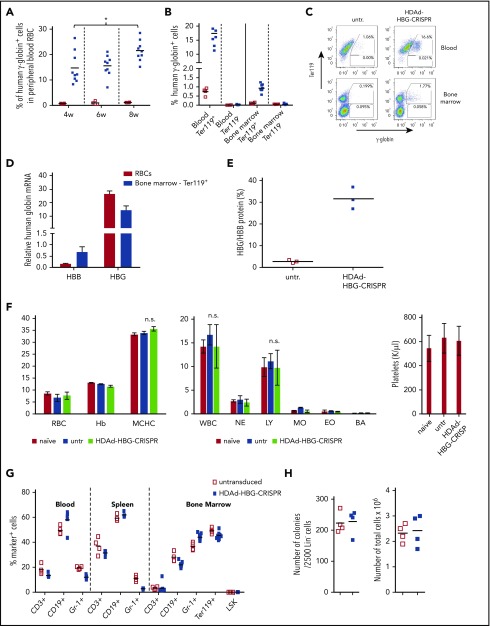
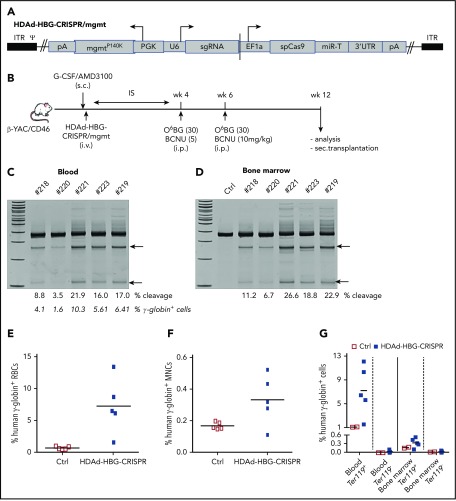
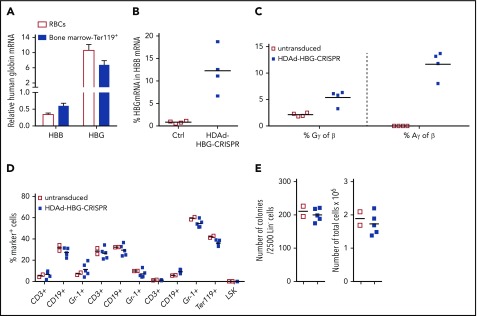
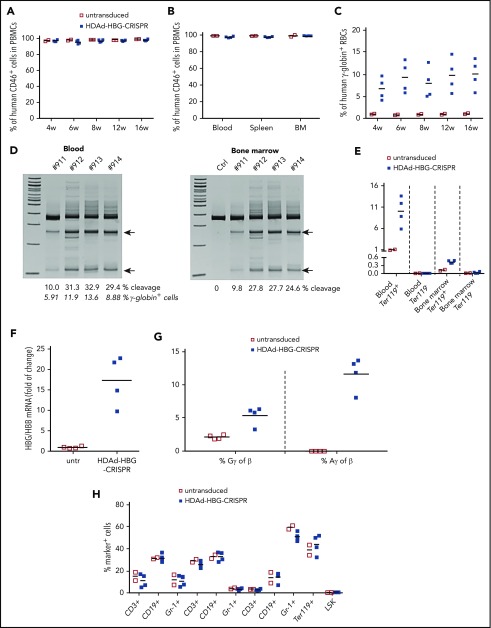
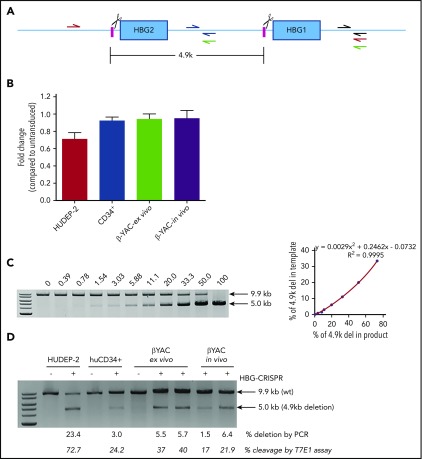
Disorders involving β-globin gene mutations, primarily β-thalassemia and sickle cell disease, represent a major target for hematopoietic stem/progenitor cell (HSPC) gene therapy. This includes CRISPR/Cas9-mediated genome editing approaches in adult CD34+ cells aimed toward the reactivation of fetal γ-globin expression in red blood cells. Because models involving erythroid differentiation of CD34+ cells have limitations in assessing γ-globin reactivation, we focused on human β-globin locus-transgenic (β-YAC) mice. We used a helper-dependent human CD46-targeting adenovirus vector expressing CRISPR/Cas9 (HDAd-HBG-CRISPR) to disrupt a repressor binding region within the γ-globin promoter. We transduced HSPCs from β-YAC/human CD46-transgenic mice ex vivo and subsequently transplanted them into irradiated recipients. Furthermore, we used an in vivo HSPC transduction approach that involves HSPC mobilization and the intravenous injection of HDAd-HBG-CRISPR into β-YAC/CD46-transgenic mice. In both models, we demonstrated efficient target site disruption, resulting in a pronounced switch from human β- to γ-globin expression in red blood cells of adult mice that was maintained after secondary transplantation of HSPCs. In long-term follow-up studies, we did not detect hematological abnormalities, indicating that HBG promoter editing does not negatively affect hematopoiesis. This is the first study that shows successful in vivo HSPC genome editing by CRISPR/Cas9.


Conflict of interest statement

Conflict-of-interest disclosure: The authors declare no competing financial interests.

Figures

None
Graphical abstract
Figure 1.
Figure 1.
Studies with human CD34+cells. (A) Schematic structure of globin locus with localization of the sgRNA in the promoters of the γ-globin genes, the CRISPR/Cas9 cleavage site (arrowhead), the 13-bp (−114 to −102) HPFH deletion (box), and the BCL11A-binding motif (“TGACCA” bold sequence). Note that only the distal TGACCA motif (red) within the indicated sequence is critical for γ-globin silencing. The CRISPR/Cas9 cleavage site is located 2 bp upstream of the BCL11A binding motif. ε, Gγ, Aγ, δ, and β are globin genes. (B) HDAd-HBG-CRISPR vector structure. The sgRNA gene is transcribed by PolIII from the U6 promoter, and the spCas9 gene is under the control of the EF1α promoter. Cas9 expression is controlled by miR-183-5p and miR-218-5p, which suppress Cas9 expression in HDAd producer cells but do not negatively affect Cas9 expression in CD34+ cells. The corresponding microRNA target sites (miR-T) were embedded into a 3′untranslated region (3′UTR). (C) Experimental design. CD34+ cells were transduced with HDAd-HBG-CRISPR at a multiplicity of infection of 2000 vp’s per cell. Two days later, cells were infected with HDAd–anti-CRISPR at the same multiplicity of infection to terminate CRISPR/Cas9 activity and, thus, minimize cytotoxicity to HSPCs. (The 2 anti-CRISPR peptides [AcrII4 and AcrII2] expressed from this vector are capable of binding to the CRISPR/Cas9 complex, thus blocking its activity.) Sixteen hours after the last infection, CD34+ cells were transplanted into irradiated NSG mice. Untransduced cells were incubated for 2 days + 16 hours in the same medium as transduced cells. At week 10 after transplantation, human CD45+ cells were isolated from the bone marrow by magnetic-activated cell sorting and subjected to T7E1 assay and erythroid in vitro differentiation for globin analysis by flow cytometry and HPLC. (D) Target site cleavage frequency (measured by T7E1 assay) in human CD45+ cells isolated from bone marrow at week 10 after transplantation. Each lane is an individual mouse. (E) γ-Globin flow cytometry of cells after erythroid in vitro differentiation. (F) Ratio of γ-globin to adult α- or β-globin measured by HPLC after erythroid differentiation. n = 3. HS, DNase I hypersensitivity sites; untr, mice transplanted with untransduced CD34+ cells.
Figure 2.
Figure 2.
Ex vivo transduction of β-YAC/CD46 Lincells with HDAd-HBG-CRISPR and subsequent transplantation. (A) Schematic diagram of the experiment. Bone marrow was harvested from β-YAC/CD46 mice, and Lin cells were isolated by magnetic-activated cell sorting. Lin cells were transduced with HDAd-HBG-CRISPR vector at a multiplicity of infection of 500 vp’s per cell (blue squares) or were left untransduced (empty red squares). After 1 day in culture, 1 × 10⁶ transduced cells per mouse were transplanted into lethally irradiated C57BL/6 mice. Animals were euthanized at week 10, and bone marrow Lin cells were transplanted into secondary recipients that were subsequently followed for 16 weeks. (B) Engraftment at week 10 based on the percentage of human CD46+ cells in mononuclear cells of blood, spleen, and bone marrow. (C) Percentage of HBG target site cleavage measured by T7E1 assay at week 10 after transplantation in the indicated samples. Each symbol represents an individual mouse. Cells from colonies were pooled, and genomic DNA was isolated. (The corresponding polyacrylamide gels for the graphs are shown in supplemental Figure 4.) (D) Percentage of total HBG indels obtained by deep sequencing of DNA from total bone marrow mononuclear cells at week 10 after transplantation. Each symbol is an individual animal. (E) Top 30 most frequent indels found in mouse #976 (indel percentage = 58%). The blue sequence shows the target of the sgRNA with the TGACCA BCL11A binding motif underlined. The horizontal bold black line indicates the −114 to −102 HPFH. The CRISPR/Cas9 cleavage site is marked by a red arrowhead. The right panels show the number and percentage of reads for the corresponding indel. A complete list of the indels in all 3 mice is provided in supplemental Table 3. CFU, colony-forming units; MNC, mononuclear cells.
Figure 3.
Figure 3.
Analysis of human γ-globin reactivation and hematological parameters after ex vivo transduction of β-YAC/CD46 Lincells with HDAd-HBG-CRISPR and subsequent transplantation. (A) Percentage of human γ-globin+ cells in peripheral blood RBCs measured by flow cytometry in blood samples taken at weeks 4, 6, and 8 after transplantation with untransduced Lin cells (□) and HDAd-HBG-CRISPR–transduced Lin cells (▪). *P < .05. (B-E) Analysis of samples collected at week 10 posttransplantation. (B) Percentage of human γ-globin+ cells in erythroid (Ter119+) and nonerythroid (Ter119) cells in blood and bone marrow. (C) Representative flow cytometry samples for data shown in (B). (D) Relative human β-globin (HBB) and γ-globin (HBG) mRNA levels in mice transplanted with HDAd-HBG-CRISPR–transduced Lin cells compared with mRNA levels in untransduced settings (taken as 1.0). (E) HPLC data. Percentage of human γ-globin protein relative to human β-globin protein. (F-H) Safety of ex vivo HDAd-HBG-CRISPR genome editing in mouse HSPCs. (F) Hematological parameters at week 10 include RBCs (M/μL), hemoglobin (hB; g/dL), mean corpuscular hemoglobin concentration (MCHC; g/dL), white blood cells (WBC; K/μL); neutrophils (NE; K/μL); lymphocytes (LY; K/μl); monocytes (MO; K/μl); eosinophils (EO; K/μL), and basophils (BA; K/μL), and platelets (K/μL). n = 3. (G) Cell composition in blood, spleen, and bone marrow at week 10 after transplantation. Shown is the percentage of lineage marker-positive cells (CD3+, CD19+, Gr-1+, Ter119+ cells) and HSPCs (LSK cells). (H) Colony-forming potential of bone marrow Lin cells harvested at week 10 posttransplantation. Number of colonies that formed after plating of 2500 Lin cells (left panel) and total number of cells pooled from colonies (right panel). Each point represents an individual animal. n.s., not significant.
Figure 4.
Figure 4.
In vivo HDAd-HBG-CRISPR/mgmt transduction of mobilized HSPCs in β-YAC/CD46 mice. (A) Structure of HDAd-HBG-CRISPR/mgmt vector. In addition to the HBG CRISPR/Cas9 cassette, the vector contained a PGK promoter-driven mgmtP140K gene. (B) Schematic diagram of the experiment. β-YAC/CD46 mice were mobilized by subcutaneous injections of G-CSF and AMD3100 and were subsequently injected intravenously with HDAd-HBG/CRISPR/mgmt. To avoid immune responses against the bacterial Cas9 and human mgmtP140K proteins expressed from the episomal vector, mice received immunosuppressive drugs (IS) for 4 weeks. At weeks 4 and 6, mice were injected intraperitoneally with O6BG/BCNU at the indicated doses. Animals were euthanized at week 12 after in vivo transduction, and tissues were analyzed. Bone marrow Lin cells were transplanted into C57BL/6 mice. T7E1 assay on total blood (C) and bone marrow (D) mononuclear cells at week 12 posttransduction. Specific cleavage products are indicated by arrows. The numbers above the gels are ID tags of individual mice. The numbers below the gels are the percentages of target site cleavage. The percentage of γ-globin+ cells in RBCs is also indicated. (E) Percentage of human γ-globin+ cells in peripheral blood RBCs measured by flow cytometry in blood samples. (F) Percentage of human γ-globin+ cells in total bone marrow mononuclear cells. (G) Percentage of human γ-globin+ cells in erythroid (Ter119+) and nonerythroid (Ter119) cells in blood and bone marrow. Ctrl, mock-transduced mice.
Figure 5.
Figure 5.
β-Globin to γ-globin switch in in vivo–transduced β-YAC/CD46 mice and hematological parameters. (A) Relative human β-globin (HBB) and γ-globin (HBG) mRNA levels in peripheral blood RBCs and bone marrow erythroid Ter-119+ cells. mRNA levels in untransduced mice were taken as 1.0. (B) Percentage of HBG mRNA of human HBB mRNA (untransduced, empty red squares; HDAd-HBG-CRISPR–transduced, blue squares). (C) HPLC data. Percentage of human Gγ- and Aγ-globin protein relative to human β-globin protein in RBCs from untransduced and HDAd-HBG-CRISPR mice (week 12 after transduction). (D-E). Hematological safety of in vivo HDAd-HBG-CRISPR genome editing. (D) Cellular composition in blood (CD3+, CD19+, Gr-1+), spleen (CD3+, CD19+, Gr-1+), and bone marrow (CD3+, CD19+, Gr-1+, Ter119+, LSK) at week 12 after in vivo transduction. Shown is the percentage of lineage marker–positive cells (CD3+, CD19+, Gr-1+, Ter119+ cells) and HSPCs (LSK cells). (E) Colony-forming potential of bone marrow Lin cells harvested at week 12 after in vivo HSPC transduction of β-YAC/CD46 mice. Number of colonies that formed after plating of 2500 Lin cells (left panel) and total number of cells pooled from colonies (right panel). Each point is an individual animal.
Figure 6.
Figure 6.
Analysis of secondary recipients (in vivo HSPC transduction approach). Bone marrow Lin cells harvested from in vivo–transduced β˗YAC/CD46 mice at week 12 after transduction were transplanted into lethally irradiated C57BL/6 mice. Secondary recipients were followed for 16 weeks. (A) Engraftment measured in blood samples at the indicated time points based on the percentage of human CD46+ cells in PBMCs. (B) Engraftment at week 16 based on the percentage of human CD46+ cells in mononuclear cells of blood, spleen, and bone marrow (BM). (C) Human γ-globin expression in secondary recipients. Shown is human γ-globin expression on RBCs from week 4 to week 16 after transplantation. (D) T7E1 assay on total blood and bone marrow mononuclear cells at week 16 posttransplantation. Specific cleavage products are indicated by arrows. The numbers above the gels are ID tags of individual mice. The numbers below the gels are the percentages of target site cleavage. For blood cells, the percentage of γ-globin+ cells in RBCs is also indicated. (E) Percentage of human γ-globin+ cells in erythroid (Ter119+) and nonerythroid (Ter119) cells in blood and bone marrow (week 16 posttransplantation). (F) Percentage of HBG mRNA of human HBB mRNA. (G) HPLC data. Percentage of human Gγ- and Aγ-globin protein relative to human β-globin protein in RBCs from untransduced and HDAd-HBG-CRISPR mice (week 16 posttransplantation). (H) Cellular composition in blood (CD3+, CD19+, Gr-1+), spleen (CD3+, CD19+, Gr-1+), and bone marrow (CD3+, CD19+, Gr-1+, Ter119+, LSK) at week 16 after transplantation.
Figure 7.
Figure 7.
Analysis of a 4.9-kb deletion containing the HBG2 gene and the HBG2/HBG1 intergenic region. (A) Diagram showing the HBG1/2 region. The HBG CRISPR/Cas9 cleavage sites are indicated by scissors. Quantitative PCR (qPCR) primers targeting the intergenic sequence between the cleavage sites are indicated (blue half arrows). Another pair of primers binding outside of the deletion region (gray half arrows) was used as an internal control to adjust for differences in template DNA quality. Primers for semiquantitative PCR include the red primers (a 9.9-kb product would indicate no 4.9 kb deletion; a 5.0-kb product would indicate a 4.9-kb deletion), and green primers (a 3.9-kb product would indicate an inversion of the 4.9-kb region). (B) Comparative qPCR to detect the 4.9-kb deletion (blue and gray primers) in (A). HUDEP-2, human CD34+ cells, or βYAC/CD46 Lin cells (β-YAC-ex vivo) were transduced with HDAd-HBG-CRISPR at a multiplicity of infection of 500, 1000, or 500 vp’s per cell, respectively. For CD34+ cells, a second transduction with HDAd–anti-CRISPR (multiplicity of infection = 1000) was conducted 2 days later. Genomic DNA was isolated at day 4 posttransduction. Furthermore, Lin cells harvested at week 12 from in vivo HSPC-transduced β-YAC/CD46 mice were analyzed (β-YAC-in vivo). Untransduced samples were used for comparison of qPCR signals. Comparative qPCR was performed in sextuplicates. The signals from the intergenic HBG1/2 region (blue primers) were normalized to corresponding signals from the outside control region (gray primers) in (A). Data were calculated by the 2-ΔΔCt approach (a relative quantification strategy for qPCR data) and are shown as fold change compared with corresponding untransduced cells (taken as 1.0). (C-D) Semiquantitative PCR to detect the 4.9-kb deletion (red primers) or inversion (green primers) in (A). (C) Standard curve for detection of the 4.9-kb deletion. Genomic DNA isolated from untreated wild-type HUDEP-2 cells and a HDAd-HBG-CRISPR–transduced HUDEP-2 clone with a biallelic 4.9-kb deletion (supplemental Materials and methods) were mixed at various ratios and used as a template for PCR. The percentage of the PCR signal corresponding to the deletion is shown above the gel (left panel). Signals were quantified by ImageQuant and used to build a standard curve (right panel). (D) Percentage of the PCR signal corresponding to the 4.9-kb deletion in samples in (B). Two mice for the ex vivo and in vivo HDAd-HBG-CRISPR–transduction settings were used. The lower row of numbers shows the cleavage frequency measured by T7E1 assay in the given samples. Another PCR using the green primers did not show signals, indicating the absence of an inversion of the 4.9-kb region. The primers were validated using a synthesized gBlock as a positive control.

References

    1. Stamatoyannopolous G, Nienhuis AW. Hemoglobin switching. In: Stamatoyannopolous G, Nienhuis AW, Majerus PW, Varmus H, eds. The Molecular Basis of Blood Diseases. Philadelphia, PA: Saunders; 1994:107-155.
    1. Fraser P, Grosveld F. Locus control regions, chromatin activation and transcription. Curr Opin Cell Biol. 1998;10(3):361-365. - PubMed
    1. Bulger M, Groudine M. Looping versus linking: toward a model for long-distance gene activation. Genes Dev. 1999;13(19):2465-2477. - PubMed
    1. Forget BG. Molecular basis of hereditary persistence of fetal hemoglobin. Ann N Y Acad Sci. 1998;850(1):38-44. - PubMed
    1. Vinjamur DS, Bauer DE, Orkin SH. Recent progress in understanding and manipulating haemoglobin switching for the haemoglobinopathies. Br J Haematol. 2018;180(5):630-643. - PubMed

Publication types