. 2018 Jun 20;38(25):5688-5699.
doi: 10.1523/JNEUROSCI.3354-17.2018. Epub 2018 May 22.

Identification and Characterization of a Novel Spontaneously Active Bursty GABAergic Interneuron in the Mouse Striatum

Affiliations

Identification and Characterization of a Novel Spontaneously Active Bursty GABAergic Interneuron in the Mouse Striatum

Maxime Assous et al. J Neurosci. .

Abstract

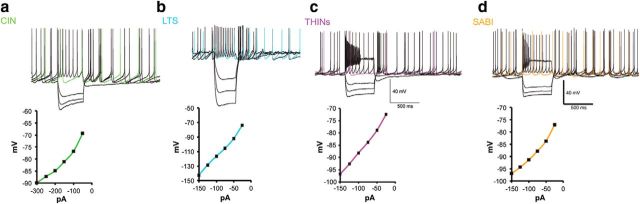
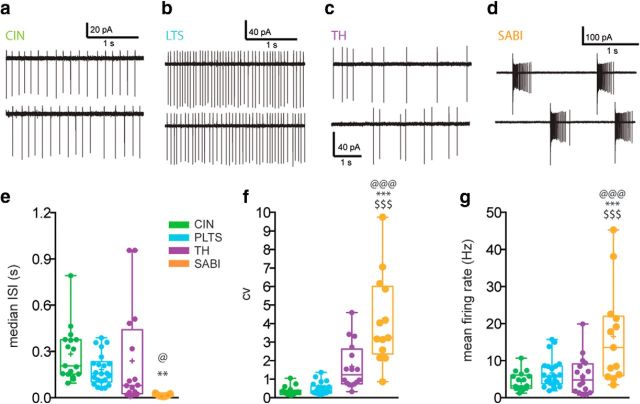
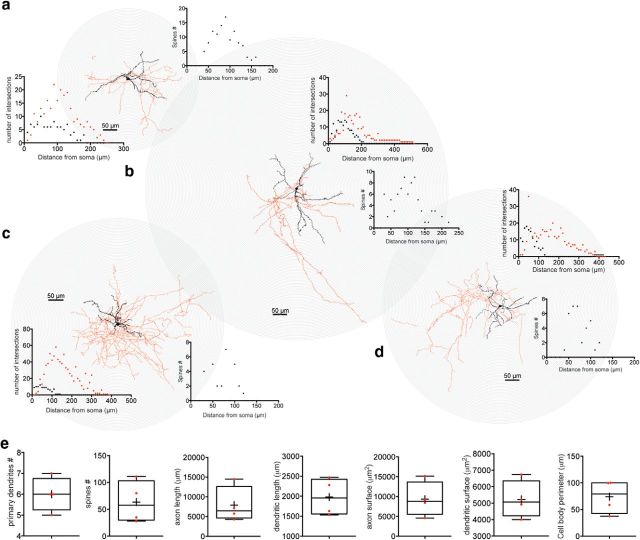
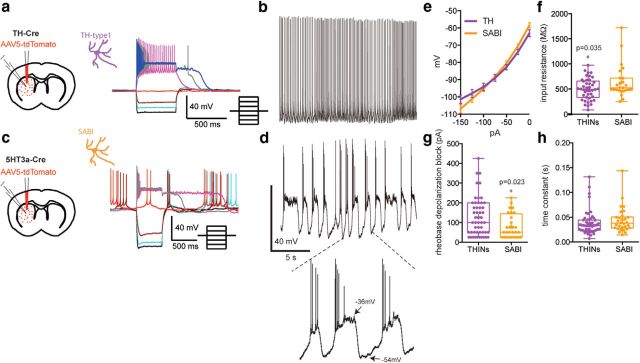
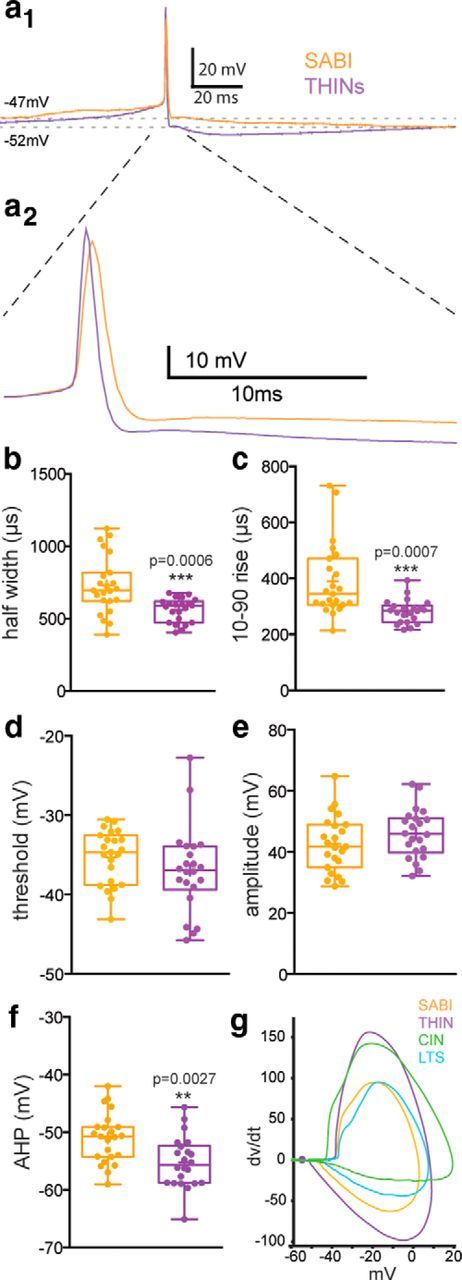
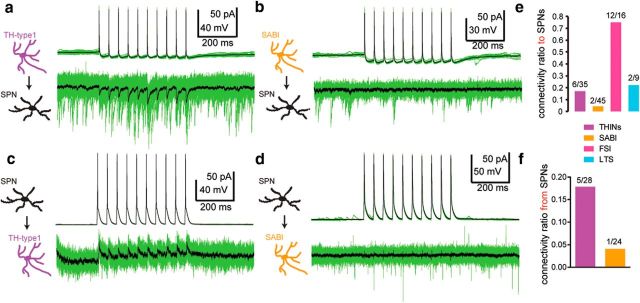
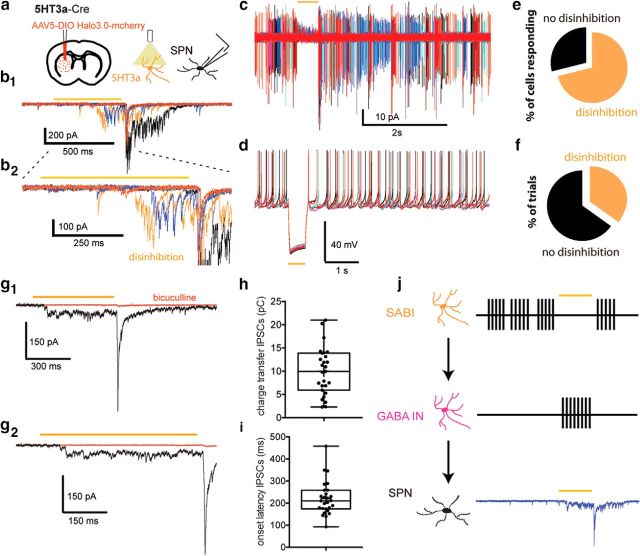
The recent availability of different transgenic mouse lines coupled with other modern molecular techniques has led to the discovery of an unexpectedly large cellular diversity and synaptic specificity in striatal interneuronal circuitry. Prior research has described three spontaneously active interneuron types in mouse striatal slices: the cholinergic interneuron, the neuropeptide Y-low threshold spike interneuron, and the tyrosine hydroxylase interneurons (THINs). Using transgenic Htr3a-Cre mice, we now characterize a fourth population of spontaneously active striatal GABAergic interneurons termed spontaneously active bursty interneurons (SABIs) because of their unique burst-firing pattern in cell-attached recordings. Although they bear some qualitative similarity in intrinsic electrophysiological properties to THINs in whole-cell recordings, detailed analysis revealed significant differences in many intrinsic properties and in their morphology. Furthermore, all previously identified striatal GABAergic interneurons have been shown to innervate striatal spiny projection neurons (SPNs), contributing to the suggestion that the principal function of striatal GABAergic interneurons is to provide feedforward inhibition to SPNs. Here, very surprisingly, paired recordings show that SABIs do not innervate SPNs significantly. Further, optogenetic inhibition of striatal Htr3a-Cre interneurons triggers barrages of IPSCs in SPNs. We hypothesize that these IPSCs result from disinhibition of a population of GABAergic interneurons with activity that is constitutively suppressed by the SABIs. We suggest that the SABIs represent the first example of a striatal interneuron-selective interneuron and, further, that their existence, along with previously defined interneuronal networks, may participate in the formation of SPN ensembles observed by others.SIGNIFICANCE STATEMENT Before ∼2010, the main function of the three known subtypes of striatal GABAergic interneurons was assumed to mediate feedforward inhibition of the spiny neurons (SPNs). During the past decade, we and others have described several novel populations of striatal GABAergic interneurons and their synaptic connections and have shown that striatal interneurons and SPNs interact through extensive and highly cell-type-specific connections that form specialized networks. Here, we describe a novel population of striatal GABAergic interneuron and provide several lines of evidence suggesting that it represents the first interneuron-selective interneuron in striatum. Striatal interneurons and their synaptic connections are suggested to play an important role in the formation of ensembles of striatal SPNs interconnected by inhibitory axon collaterals.

Keywords: basal ganglia; interneuron; interneuron-selective; network; optogenetic; striatum.


Figures

Figure 1.
Figure 1.
Whole-cell current-clamp recordings of spontaneously active interneurons in mouse striatum. ad, Membrane potential responses to injected current pulses (top) and current voltage responses (bottom) of spontaneously active striatal interneurons. a, Example of a typical CIN recorded in a ChAT-ChR2 mouse, b, NPY–LTS interneuron recorded in slice from an NPY-GFP mouse, c, d, THIN recorded in slice from a TH-Cre mouse (c) and SABI (d) (see below) recorded in slice from a Htr3a-Cre mouse. Note the strong similarities in appearance between the THIN (c) and the SABI (d).
Figure 2.
Figure 2.
Cell-attached voltage-clamp recordings of spontaneously active interneurons in mouse striatum. ad, Representative cell-attached recordings of the same four interneuron types shown in Figure 1. a, b, CIN (a) and LTS (b) interneurons exhibit tonic, regular firing patterns. Most THINs (c) also exhibit tonic, but less regular firing. In contrast, most SABIs (d) exhibit extreme burst firing showing spike frequency adaptation, separated by periods of complete silence. eg, Box plots representing the median ISI (e), CV (f), and mean firing rate (g) of the four interneuron populations measured in cell-attached mode. SABIs exhibit a significantly lower median ISI, a higher CV, and a higher firing rate than all the other spontaneously active interneurons. Box plots represent the minimum and maximum interquartile range and the mean and median. One-way ANOVA followed by Tukey's multiple-comparisons test: @SABI versus TH, *SABI versus CIN, and $SABI versus LTS.
Figure 3.
Figure 3.
Bursting properties of SABIs. a, Box plots representing the BI (see text) of the spontaneously active interneuron populations. Note that the SABIs exhibit a significantly higher BI than all the other interneurons. b, Scatterplot of the BI (see text) versus the CV of the spontaneously active interneurons. Note that the LTS (blue) and CIN (green) are grouped in the bottom left, whereas the SABI (orange) are scattered in the top right of the graph. c, Example of the burst detection method used (ISI-N, see text). Black bars represent action potentials of SABI and red bars below represent groups of action potentials detected as bursts in a representative 30 s spike train. dg, Box plots of different parameters of the burst analysis for the SABI. d, Percentage of spikes fired inside a burst. e, Number of spikes per burst. f, Average spike frequency inside the burst. g, Difference in spike frequency at the beginning versus at the end of the burst showing strong spike frequency adaptation. Box plots represent the minimum and maximum interquartile range and the mean and median. One-way ANOVA followed by Tukey's multiple-comparisons test: @SABI versus TH, *SABI versus CIN, and $SABI versus LTS.
Figure 4.
Figure 4.
Neurocytology of typical electrophysiologically identified SABI interneurons labeled with biocytin after whole-cell recording. Shown are typical photomicrographs of single 100 μm sections of resectioned biocytin-filled SABIs visualized with DAB staining. SABIs emit several primary dendrites that extend ∼50 μm before branching. Secondary and higher-order dendrites are sparsely invested with dendritic spines (black arrows, box 1 and box 3). The axonal arborization was to be relatively sparse (compared with those of THINs and FSIs), exhibited prominent varicosities, and comprised small dense and tortuous fields near the soma (box 4), as well as sparse extended axons that extended well beyond the dendritic arborization (box 3).
Figure 5.
Figure 5.
3D reconstruction and Sholl analysis of SABIs filled with biocytin after recording. ad, 3D reconstruction of four different SABIs. The soma and dendritic fields are represented in black and the axon in red in the reconstructed image and the associated Sholl plot. The number of spines plotted against the distance to the soma is represented in black. SABIs dendrites extend 150–200 μm away from the cell body,presenting a maximum number of intersection at ∼50 μm. The axonal field is relatively sparse, extending from 250–550 μm away from the soma and reaching a maximum number of intersections at ∼150 μm. e, Box plots showing the quantification of the number of primary dendrites, number of spines, the axon and dendritic length and surface, as well as the cell body perimeter of the four SABIs fully reconstructed.
Figure 6.
Figure 6.
Differences in intrinsic electrophysiological properties between THINs and SABIs. a, c, Left, Schematics representing the experimental paradigms for AAV transduction with double floxed Td-Tomato of striatal TH and SABI interneurons in TH-Cre (a) and Htr3a-Cre (c) mice. Right, Membrane potential responses to injected current pulses of type I THINs (a) and SABIs (c). Both interneurons present a relatively high input resistance and a long-lasting plateau potential after depolarizing current pulse injection. Note the firing pattern of the SABI (c) that is often constituted of doublets or triplets of action potentials. b, Typical spontaneous firing activity of a THIN recorded in current-clamp mode. Note the regular tonic activity. d, Spontaneous firing activity recorded in approximately half of SABI exhibit membrane potential fluctuations resembling up and down states in SPNs, with action potential firing happening only during the beginning of the up state. e, I–V curve of populations of type I THINs (purple) and SABIs (orange). Although similar, the I–V curves are significantly different near rest. f, THINs and SABIs possess large input resistance. Although largely overlapping, SABI input resistance is significantly higher than that of THINs. g, Box plot measuring the minimum current necessary to induce depolarization block. h, Box plot of the membrane time constants of the two interneuron populations representing the minimum and maximum interquartile range and the mean and median. Statistical analysis was made using unpaired t test.
Figure 7.
Figure 7.
Comparison of action potential properties between THINs and SABI. a1, Action potential waveform of a type I THIN (purple) and a SABI (orange). a2, Expanded view of a1 clarifying the differences in the rising and falling phases of the action potential waveform and the AHP of the two interneuron populations. bf, Box plots showing the minimum and maximum interquartile range and the mean and median reveal significant differences in spike half-width, rise time, threshold, amplitude, and AHP depth between THINs and SABIs. g, Phase plots reporting dV/dt as a function of voltage generated for a representative action potential of the four spontaneously active populations in the striatum show clear differences (CIN, green; LTS, blue; SABI, orange; THINs, purple). Statistical analysis was made using unpaired t tests.
Figure 8.
Figure 8.
Synaptic connectivity among THINs, SABIs, and SPNs. Examples of paired whole-cell recordings demonstrate significant differences of the monosynaptic connectivity between THINs or SABIs and SPNs. a, Train of evoked action potentials in a THIN induces IPSCs in a monosynaptically connected SPN. b, Train of evoked action potentials in a SABI fails to elicit any response in a nearby SPN. c, Train of evoked action potentials in a SPN elicits IPSCs in a THIN. d, Train of evoked action potentials in a SPN fails to elicit any response in a nearby SABI. e, Summary histograms illustrating the connection rates of different spontaneously active interneurons to SPNs. FSIs (pink) exhibit the highest connection rate to SPNs; THINs and LTS interneurons are lower and the connection rate for SABIs is extremely low (see text for additional details). f, Synaptic connection rate from SPNs to SABIs is similarly low, whereas that from THINs to SPNs is ∼18. In a and b, the postsynaptic neuron was recorded with a high-chloride internal solution (125 mm CsCl).
Figure 9.
Figure 9.
Optogenetic inhibition of Htr3a interneurons evokes large barrages of GABAergic IPSCs in SPNs. a, Schematic of the experimental paradigm. AAV5 Ef1a DIO HR3.0-EYFP was injected into the striatum of Htr3a-Cre mice and SPNs were recorded ex vivo using a cesium-based high-chloride internal solution (125 mm CsCl). b1, Representative examples of raw voltage-clamp data traces recordings in a SPN in the disinhibition protocol. Orange bar indicates the yellow light pulse. b2, Expanded view of the disinhibitory IPSCs occurring during and immediately after the yellow light pulse. c, d, Cell-attached (c) and current-clamp (d) recordings of a SABI during halorhodopsin stimulation (500 ms). Note that the yellow light pulse completely blocks action potential firing of the SABI (n = 8) both in the cell-attached and current-clamp mode. e, f, Pie charts showing the percentage of cells exhibiting IPSC barrages in response to optogenetic inhibition of Htr3a-Cre interneurons (disinhibition, orange; e) and the percentage of individual trials of yellow light application in which the IPSC barrages were observed (f). g1, g2, IPSCs are blocked by bath application of bicuculline (10 μm). Note the delayed onset of the IPSCs. h, Box plot representing the charge transfer measured during the yellow light pulse (500 ms). i, Box plot representing the onset latency of the IPSCs from the start of the yellow light pulse. j, Circuit diagram depicting the disinhibitory circuit hypothesized to mediate these responses. The Htr3a-Cre interneurons that are spontaneously active (i.e., the SABIs) are inhibited by halorhodopsin, which in turn disinhibits another, as yet unidentified population of interneuron(s) evoking these IPSC barrages in SPN.

References

    1. Acsády L, Görcs TJ, Freund TF (1996a) Different populations of vasoactive intestinal polypeptide-immunoreactive interneurons are specialized to control pyramidal cells or interneurons in the hippocampus. Neuroscience 73:317–334. 10.1016/0306-4522(95)00609-5 - DOI - PubMed
    1. Acsády L, Arabadzisz D, Freund TF (1996b) Correlated morphological and neurochemical features identify different subsets of vasoactive intestinal polypeptide-immunoreactive interneurons in rat hippocampus. Neuroscience 73:299–315. 10.1016/0306-4522(95)00610-9 - DOI - PubMed
    1. Aosaki T, Tsubokawa H, Ishida A, Watanabe K, Graybiel AM, Kimura M (1994) Responses of tonically active neurons in the primate's striatum undergo systematic changes during behavioral sensorimotor conditioning. J Neurosci 14:3969–3984. 10.1523/JNEUROSCI.14-06-03969.1994 - DOI - PMC - PubMed
    1. Aosaki T, Kimura M, Graybiel AM (1995) Temporal and spatial characteristics of tonically active neurons of the primate's striatum. J Neurophysiol 73:1234–1252. 10.1152/jn.1995.73.3.1234 - DOI - PubMed
    1. Apicella P. (2017) The role of the intrinsic cholinergic system of the striatum: what have we learned from TAN recordings in behaving animals? Neuroscience 360:81–94. 10.1016/j.neuroscience.2017.07.060 - DOI - PubMed

Publication types

LinkOut - more resources