. 2018 Jun 4;215(6):1507-1518.
doi: 10.1084/jem.20180019. Epub 2018 May 22.

Tissue-resident macrophages in the intestine are long lived and defined by Tim-4 and CD4 expression

Affiliations

Tissue-resident macrophages in the intestine are long lived and defined by Tim-4 and CD4 expression

Tovah N Shaw et al. J Exp Med. .

Abstract

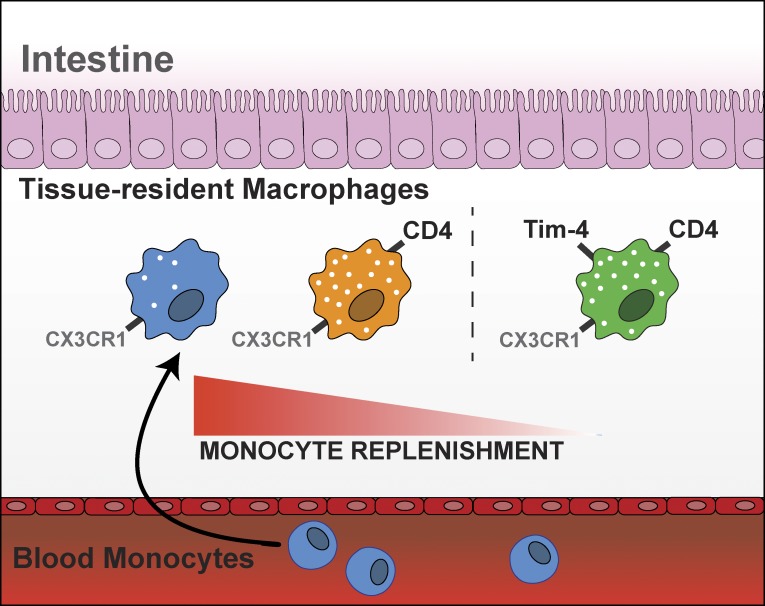
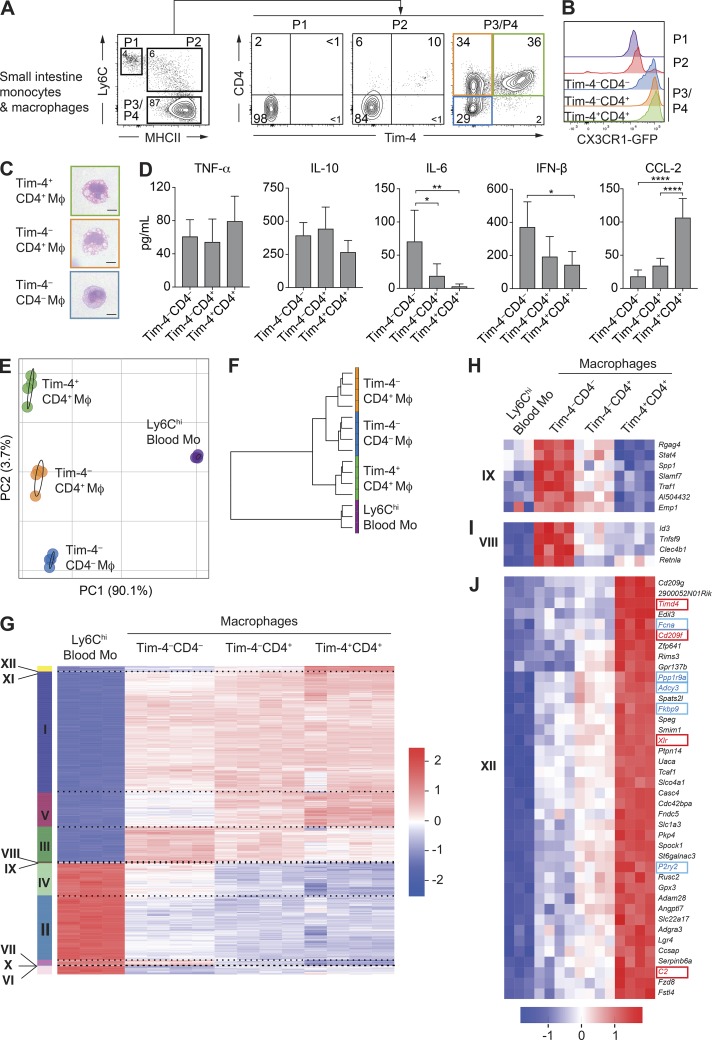
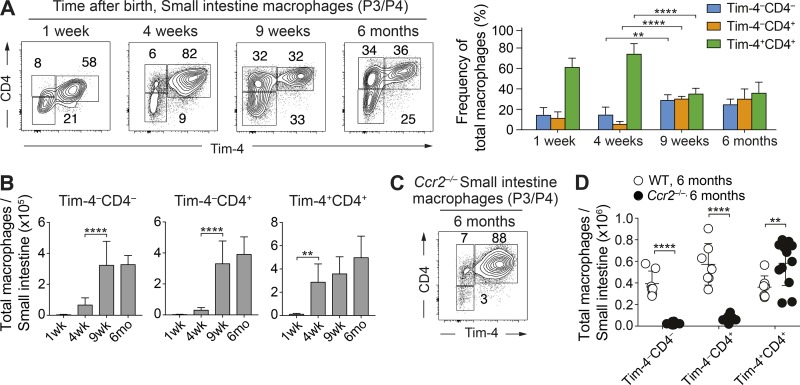
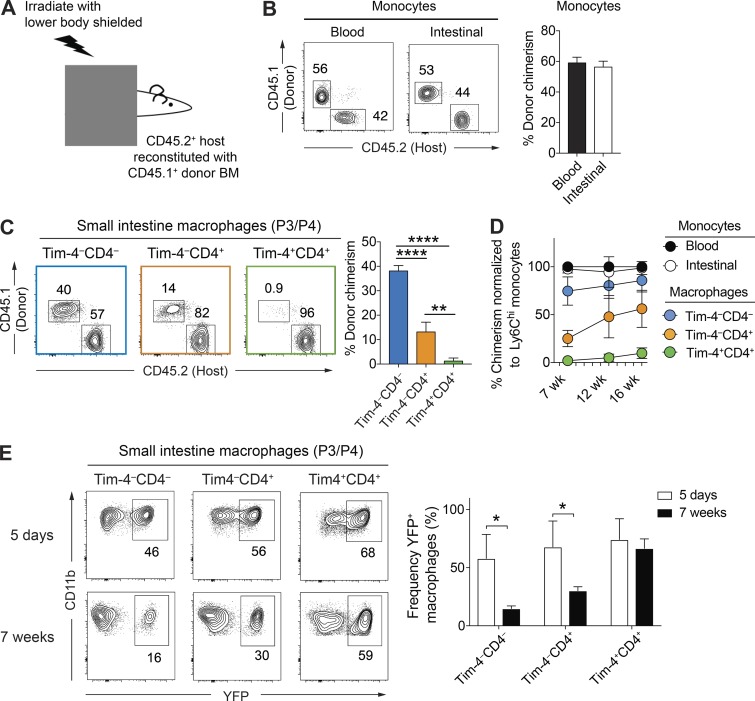
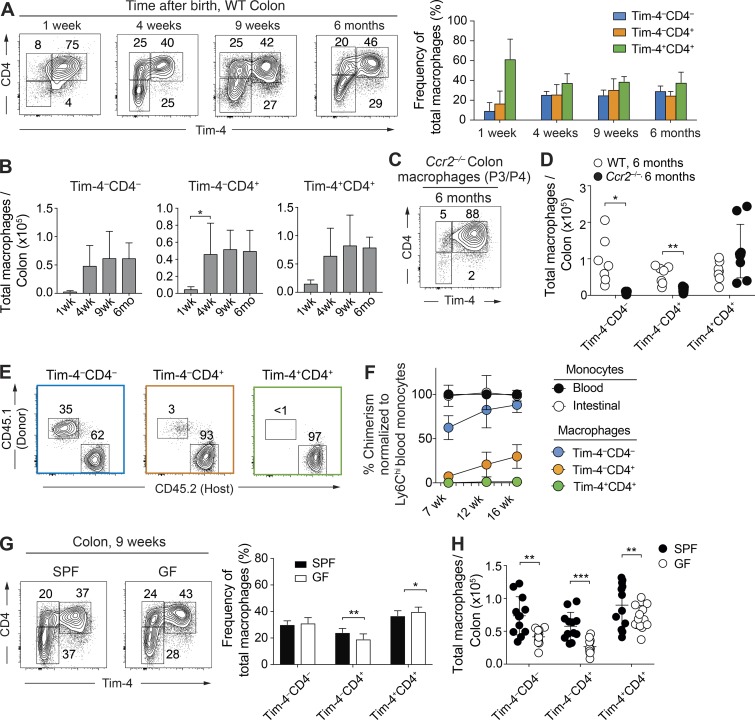
A defining feature of resident gut macrophages is their high replenishment rate from blood monocytes attributed to tonic commensal stimulation of this site. In contrast, almost all other tissues contain locally maintained macrophage populations, which coexist with monocyte-replenished cells at homeostasis. In this study, we identified three transcriptionally distinct mouse gut macrophage subsets that segregate based on expression of Tim-4 and CD4. Challenging current understanding, Tim-4+CD4+ gut macrophages were found to be locally maintained, while Tim-4-CD4+ macrophages had a slow turnover from blood monocytes; indeed, Tim-4-CD4- macrophages were the only subset with the high monocyte-replenishment rate currently attributed to gut macrophages. Moreover, all macrophage subpopulations required live microbiota to sustain their numbers, not only those derived from blood monocytes. These findings oppose the prevailing paradigm that all macrophages in the adult mouse gut rapidly turn over from monocytes in a microbiome-dependent manner; instead, these findings supplant it with a model of ontogenetic diversity where locally maintained subsets coexist with rapidly replaced monocyte-derived populations.


Figures

None
Graphical abstract
Figure 1.
Figure 1.
Tim-4 and CD4 identify phenotypically and transcriptionally distinct populations of macrophages in the small intestine. (A) Expression of Tim-4 and CD4 on small intestinal monocytes/macrophages assessed by flow cytometry from Cx3cr1+/GFP reporter mice. Single-cell suspensions were first gated on live LinCD45+CD11b+CD11clow/int cells, and then P1 monocytes (CD64Ly6ChiMHCII), P2 transitioning monocytes (Ly6C+MHCII+), and P3/P4 macrophages (CD64+Ly6CMHCII+) were identified. Numbers denote the percentages of cells within the gate. Data are representative of at least three independent experiments. n = 2–3 per experiment. (B) Expression of CX3CR1-GFP by P1 monocytes, P2 transitioning monocytes, and Tim-4CD4, Tim-4CD4+, and Tim-4+CD4+ (P3/P4) macrophages from the small intestine of adult CX3CR1+/GFP mice. Data are representative of at least three independent experiments. n = 2–3 per experiment. (C) Morphological characteristics as assessed by H&E staining of Tim-4CD4, Tim-4CD4+, and Tim-4+CD4+ macrophages (Mφ) sorted by FACS from the small intestine of 8–10-wk-old C57BL/6 WT mice. Bars, 5 µm. Data are representative of two independent sorts from three pooled mice. (D) Concentrations of TNF-α, IL-10, IL-6, IFN-β, and CCL-2 in supernatants from 18-h cultures in M-CSF–containing media of Tim-4CD4, Tim-4CD4+, and Tim-4+CD4+ macrophages sorted by FACS from the pooled small intestines of four to six pooled 8–10-wk-old C57BL/6 WT mice. Concentrations were determined from duplicate or triplicate wells of 30,000 sorted macrophages. Data are representative of five separate experiments. Error bars show means ± SD. Statistical comparisons between macrophage subsets are shown. Statistical comparisons were performed with one-way ANOVA with Bonferroni’s multiple comparison test: *, P ≤ 0.05; **, P ≤ 0.01; ****, P ≤ 0.0001. (E) PCA of global gene expression from Ly6Chi blood monocytes (Blood Mo) and Tim-4CD4, Tim-4CD4+, and Tim-4+CD4+ resident macrophages isolated by FACS from the small intestine of 8–10-wk-old C57BL/6 WT mice. (F) Hierarchical cluster analysis of Ly6Chi blood monocytes and Tim-4CD4, Tim-4CD4+, and Tim-4+CD4+ small intestine macrophage populations based on global gene expression. (G) Gene expression profile of the 2,283 genes differentially expressed (p-adjusted < 1e–30) in Ly6Chi blood monocytes, and Tim-4CD4, Tim-4CD4+, and Tim-4+CD4+ macrophages sorted from the small intestine with clusters identified by k-means. (H) Gene expression profile of the seven genes forming cluster IX up-regulated in Tim-4CD4 and Tim-4CD4+ macrophages compared with Ly6Chi blood monocytes and Tim-4+CD4+ macrophages. (I) Gene expression profile of the four genes forming cluster VIII up-regulated in Tim-4CD4 macrophages compared with Ly6Chi blood monocytes and Tim-4CD4+ and Tim-4+CD4+ macrophages. (J) Gene expression profile of the 40 genes up-regulated in Tim-4+CD4+ macrophages compared with Ly6Chi blood monocytes and Tim-4CD4 and Tim-4CD4+ macrophages. Genes highlighted in blue are those previously identified as genes associated with a tissuewide resident macrophage signature. Genes highlighted in red are those described as distinguishing embryonically derived Kupffer cells from BM-derived Kupffer cells. (E–J) RNA sequencing results were generated from four independent sorts from the small intestines of three pooled mice (macrophages) and three independent sorts from the peripheral blood of three to four pooled mice (monocytes). See also Fig. S1 and Tables S1 and S2.
Figure 2.
Figure 2.
Tim-4+CD4+ macrophages are present perinatally and are maintained in adulthood, whereas Tim-4CD4 and CD4+ macrophages are critically dependent on CCR2-mediated recruitment of monocytes. (A) Representative flow cytometry plots (left) and frequencies (right) showing expression of Tim-4 and CD4 on live LinCD45+CD11b+CD11clow/intLy6CCD64+ P3/P4 macrophages in the small intestine of C57BL/6 WT mice at indicated ages. Data are representative of at least two independent experiments. n = 5–8 per group. Statistical comparisons between weeks 4 and 9 are shown. (B) Total number of small intestinal Tim-4CD4, Tim-4CD4+, and Tim-4+CD4+ macrophages by age in C57BL/6 WT mice. Data are pooled from at least two independent experiments. n = 5–8 per group. Error bars show means ± SD. At 1 wk of age, intestines from two mice were pooled per sample. Statistical comparisons between weeks 1 and 4 and weeks 4 and 9 are shown. (C) Representative flow cytometry plots showing expression of Tim-4 and CD4 on P3/P4 macrophages in the small intestine of Ccr2−/− mice at 6 mo of age. Data are representative of at least three independent experiments. Numbers in flow cytometry plots denote the percentages of cells within the gate. (D) Total number of Tim-4CD4, Tim-4CD4+, and Tim-4+CD4+ macrophage subsets of Ccr2−/− and C57BL/6 WT mice at 6 mo of age. Data are pooled from at least three independent experiments. n = 7–12 per group; results for individual animals are shown as dots. Statistical comparisons were performed with one-way ANOVA with Bonferroni’s multiple comparison test (A and B) or with two-way Student’s t test with Welch’s correction (D): **, P ≤ 0.01; ****, P ≤ 0.0001.
Figure 3.
Figure 3.
Tim-4+CD4+ macrophages are infrequently replenished from blood monocytes, whereas Tim-4 subsets are replenished at high and low rates. (A) Schematic of gut-shielded chimera protocol to determine the contribution of blood monocytes to intestinal monocyte/macrophage subsets. C57BL/6 WT hosts aged 6–8 wk old were anaesthetized and positioned beneath a lead sheet shielding the lower two thirds of the body, including the intestine, from irradiation. Mice were reconstituted with donor BM cells from congenic CD45.1+ WT donor animals. (B) Left: Representative flow cytometry plots showing the frequency of CD45.1+ donor-derived cells within Ly6Chi monocytes of the peripheral blood and small intestine of shielded chimeric mice 7 wk after irradiation. Right: Frequency of CD45.1+ donor-derived cells within the Ly6Chi monocytes of the peripheral blood and small intestine of shielded chimeric mice 7 wk after irradiation. Data are representative of at least two independent experiments. n = 6 per group. (C) Left: Representative flow cytometry plots showing the frequency of CD45.1+ donor-derived cells within the Tim-4CD4, Tim-4CD4+, and Tim-4+CD4+ macrophage subsets of the small intestine of shielded chimeric mice 7 wk after irradiation. Right: Frequency of CD45.1+ donor-derived cells within the Tim-4CD4, Tim-4CD4+, and Tim-4+CD4+ macrophage subsets of the small intestine of shielded chimeric mice 7 wk after irradiation. Data are representative of at least two independent experiments. n = 6 per group. (D) At 7, 12, and 16 wk after irradiation, the frequency of donor-derived cells was determined in the intestinal Ly6Chi monocyte and macrophage subpopulations of the small intestine by flow cytometry and normalized to the chimerism of Ly6Chi blood monocytes. Data are pooled from at least two independent experiments above. n = 6 per group. (E) Left: Representative flow cytometry plots showing the frequency of YFP-expressing cells within the Tim-4CD4, Tim-4CD4+, and Tim-4+CD4+ macrophage subsets of the small intestine ofCx3cr1CreER X R26-yfp mice 5 d and 7 wk after tamoxifen treatment. Right: Frequency of YFP-expressing cells within the Tim-4CD4, Tim-4CD4+, and Tim-4+CD4+ macrophage subsets of the small intestine of Cx3cr1CreER X R26-yfp mice 5 d and 7 wk after tamoxifen treatment. Numbers in flow cytometry plots denote the percentages of cells within the gate. Data are pooled from two independent experiments. n = 4–5 per group. Error bars show means ± SD. Statistical comparisons were performed with one-way ANOVA with Bonferroni’s multiple comparison test (C) or with two-way Student’s t test with Welch’s correction (E): *, P ≤ 0.05; **, P ≤ 0.01; ****, P ≤ 0.0001. See also Fig. S2.
Figure 4.
Figure 4.
Locally maintained Tim-4+CD4+ macrophages persist in commensal-rich areas of the gut and are regulated by a live microbiota. (A) Representative flow cytometry plots (left) and frequency graph (right) showing expression of Tim-4 and CD4 on live LinCD45+CD11b+CD11clow/intLy6CCD64+ P3/P4 macrophages in the colon of C57BL/6 WT mice at the indicated ages. Data are representative of at least two independent experiments. n = 5–8 per group. (B) Total number of Tim-4CD4, Tim-4CD4+, and Tim-4+CD4+ macrophage subsets by age in the colon of C57BL/6 WT mice. Data are pooled from at least two independent experiments. n = 5–8 per group. At 1 wk of age, intestines from two mice were pooled per sample. (C) Representative flow cytometry plots showing expression of Tim-4 and CD4 on P3/P4 macrophages in colon of Ccr2−/− mice at 6 mo of age. Data are representative of at least three independent experiments. (D) Total number of Tim-4CD4, Tim-4CD4+, and Tim-4+CD4+ macrophage subsets of Ccr2−/− and C57BL/6 WT mice at 6 mo of age. Data are pooled from at least three independent experiments. n = 5–9 per group; results for individual animals are shown as dots. (E) Representative flow cytometric plots showing the frequency of CD45.1+ donor-derived cells within the Tim-4CD4, Tim-4CD4+, and Tim-4+CD4+ macrophage subsets of the colon of shielded chimeric mice generated as described in Fig. 3 A 7 wk after irradiation (left). Frequency of CD45.1+ donor-derived cells within the Tim-4CD4, Tim-4CD4+, and Tim-4+CD4+ macrophage subsets of the small colon of shielded chimeric mice 7 wk after irradiation (right). Data are representative of at least two independent experiments. n = 5 per group. (F) At 7, 12, and 16 wk after irradiation, the frequency of donor-derived cells was determined in the intestinal Ly6Chi monocyte and macrophage subpopulations of the colon by flow cytometry and normalized to the chimerism of Ly6Chi blood monocytes. Data generated as described in Fig. 3 A are pooled from at least two independent experiments. n = 5–6 per group. (G) Left: Representative flow cytometry plots showing expression of Tim-4 and CD4 on P3/P4 macrophages in the colon of SPF and GF WT C57BL/6 mice at 9 wk of age. Right: Frequency of Tim-4CD4, Tim-4CD4+, and Tim-4+CD4+ macrophage subsets in the colon of 9-wk-old SPF and GF mice. Numbers in flow cytometry plots denote the percentages of cells within the gate. Data are pooled from four independent experiments. n = 12 per group. (H) Total number of Tim-4CD4, Tim-4CD4+, and Tim-4+CD4+ macrophages in the colon of SPF and GF mice at 9 wk of age. Data are pooled from four independent experiments. n = 12 per group; results for individual animals are shown as dots. Error bars show means ± SD. Statistical comparisons were performed with one-way ANOVA with Bonferroni’s multiple comparison test (B) or with two-way Student’s t test with Welch’s correction (D, G, and H): *, P ≤ 0.05; **, P ≤ 0.01; ***, P ≤ 0.001. See also Fig. S3.

References

    1. Afik R., Zigmond E., Vugman M., Klepfish M., Shimshoni E., Pasmanik-Chor M., Shenoy A., Bassat E., Halpern Z., Geiger T., et al. . 2016. Tumor macrophages are pivotal constructors of tumor collagenous matrix. J. Exp. Med. 213:2315–2331. 10.1084/jem.20151193 - DOI - PMC - PubMed
    1. A-Gonzalez N., Quintana J.A., García-Silva S., Mazariegos M., González de la Aleja A., Nicolás-Ávila J.A., Walter W., Adrover J.M., Crainiciuc G., Kuchroo V.K., et al. . 2017. Phagocytosis imprints heterogeneity in tissue-resident macrophages. J. Exp. Med. 214:1281–1296. 10.1084/jem.20161375 - DOI - PMC - PubMed
    1. Anders S., Pyl P.T., and Huber W.. 2015. HTSeq--a Python framework to work with high-throughput sequencing data. Bioinformatics. 31:166–169. 10.1093/bioinformatics/btu638 - DOI - PMC - PubMed
    1. Bain C.C., and Mowat A.M.. 2014. Macrophages in intestinal homeostasis and inflammation. Immunol. Rev. 260:102–117. 10.1111/imr.12192 - DOI - PMC - PubMed
    1. Bain C.C., Scott C.L., Uronen-Hansson H., Gudjonsson S., Jansson O., Grip O., Guilliams M., Malissen B., Agace W.W., and Mowat A.M.. 2013. Resident and pro-inflammatory macrophages in the colon represent alternative context-dependent fates of the same Ly6Chi monocyte precursors. Mucosal Immunol. 6:498–510. 10.1038/mi.2012.89 - DOI - PMC - PubMed

Publication types