. 2018 Aug 1;78(15):4253-4269.
doi: 10.1158/0008-5472.CAN-17-3876. Epub 2018 May 22.

Macrophage-Derived Granulin Drives Resistance to Immune Checkpoint Inhibition in Metastatic Pancreatic Cancer

Affiliations

Macrophage-Derived Granulin Drives Resistance to Immune Checkpoint Inhibition in Metastatic Pancreatic Cancer

Valeria Quaranta et al. Cancer Res. .

Abstract

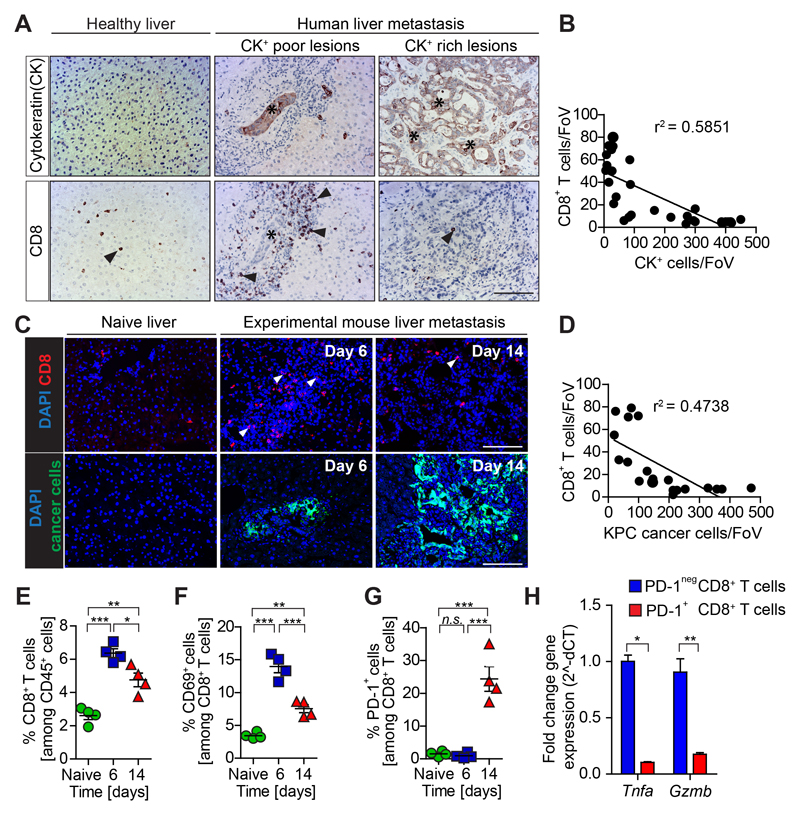
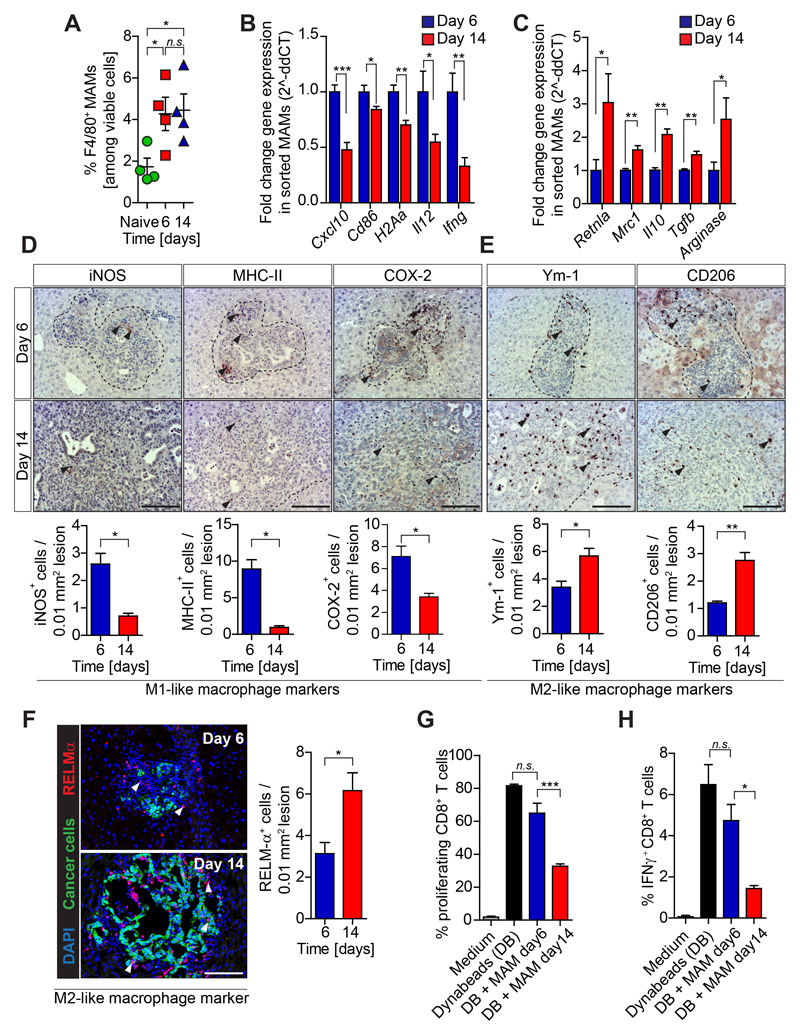
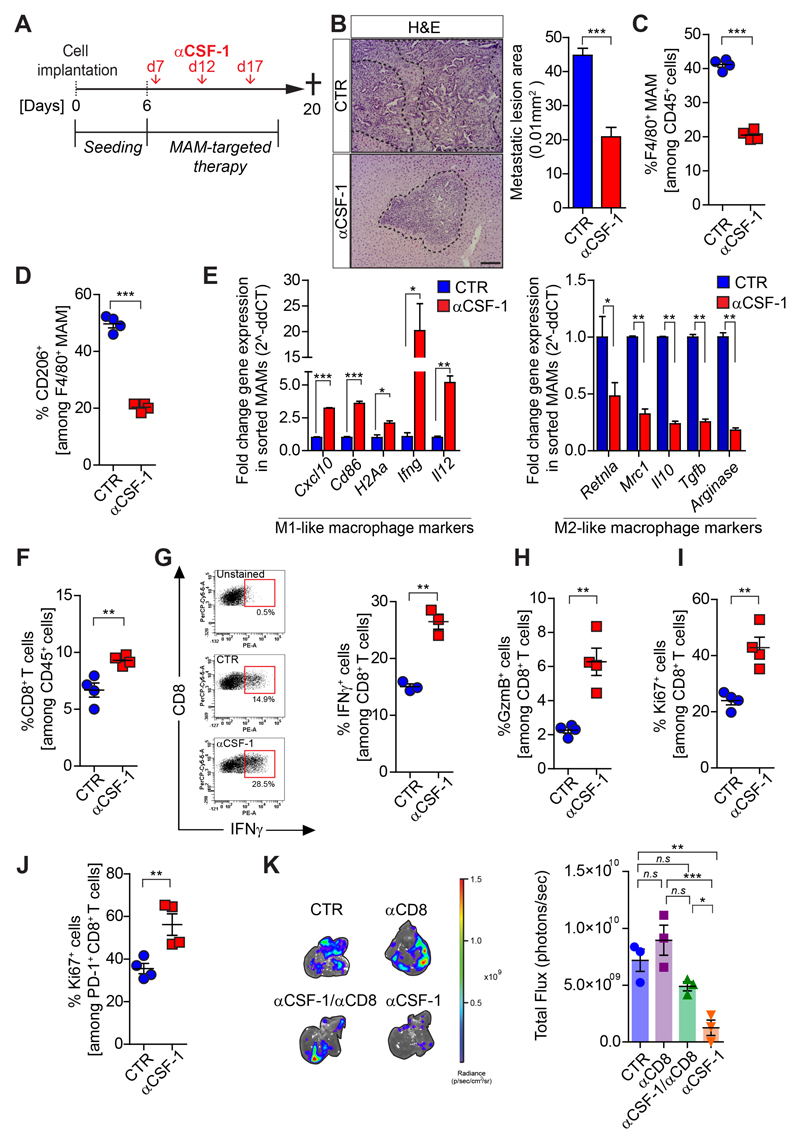
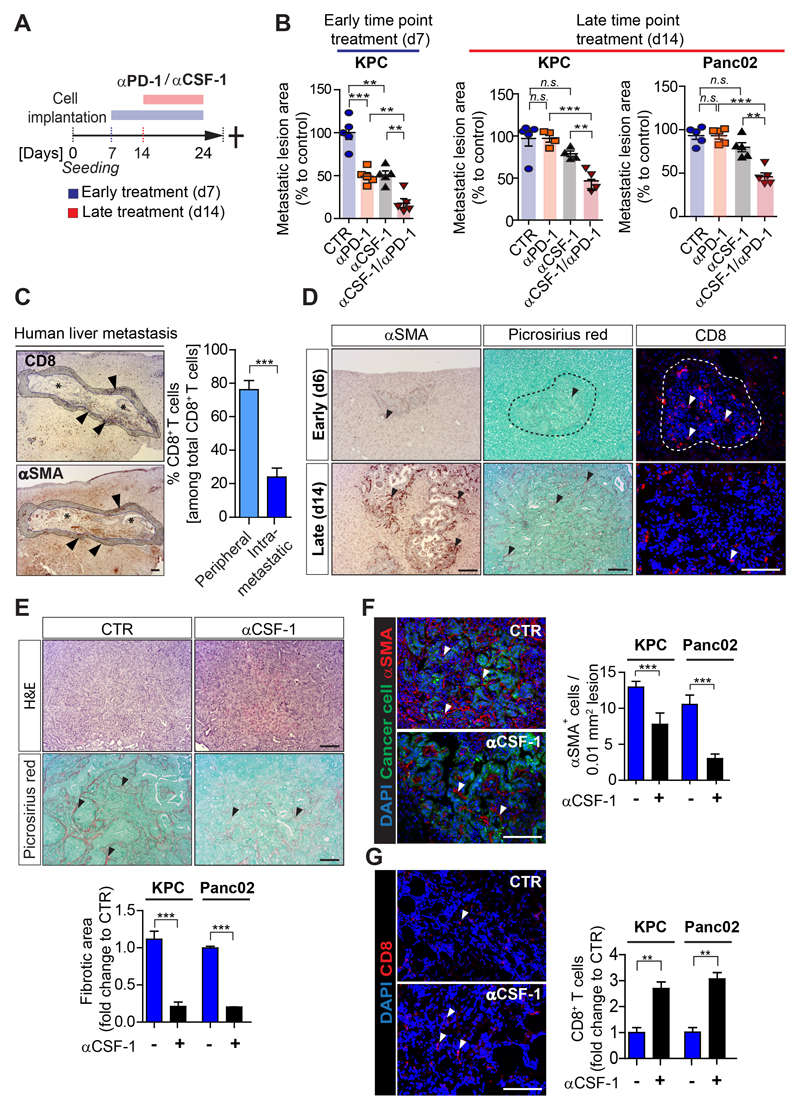
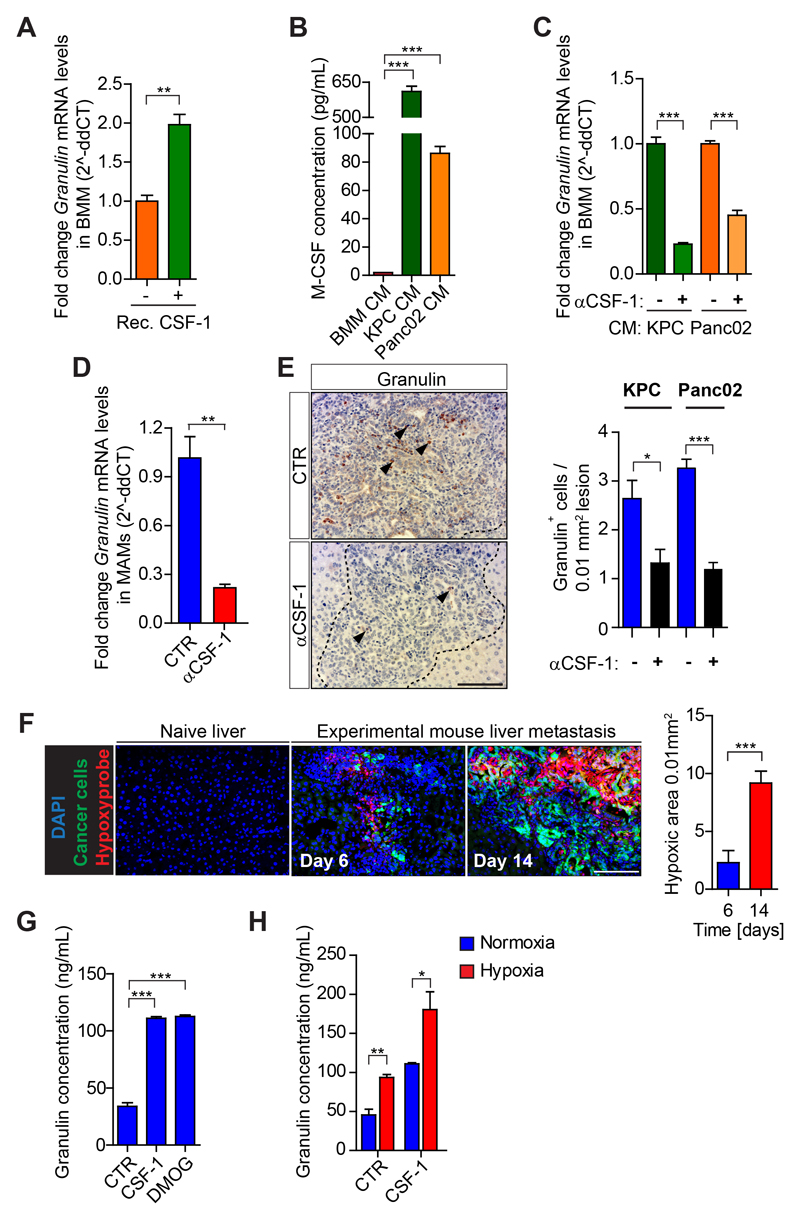
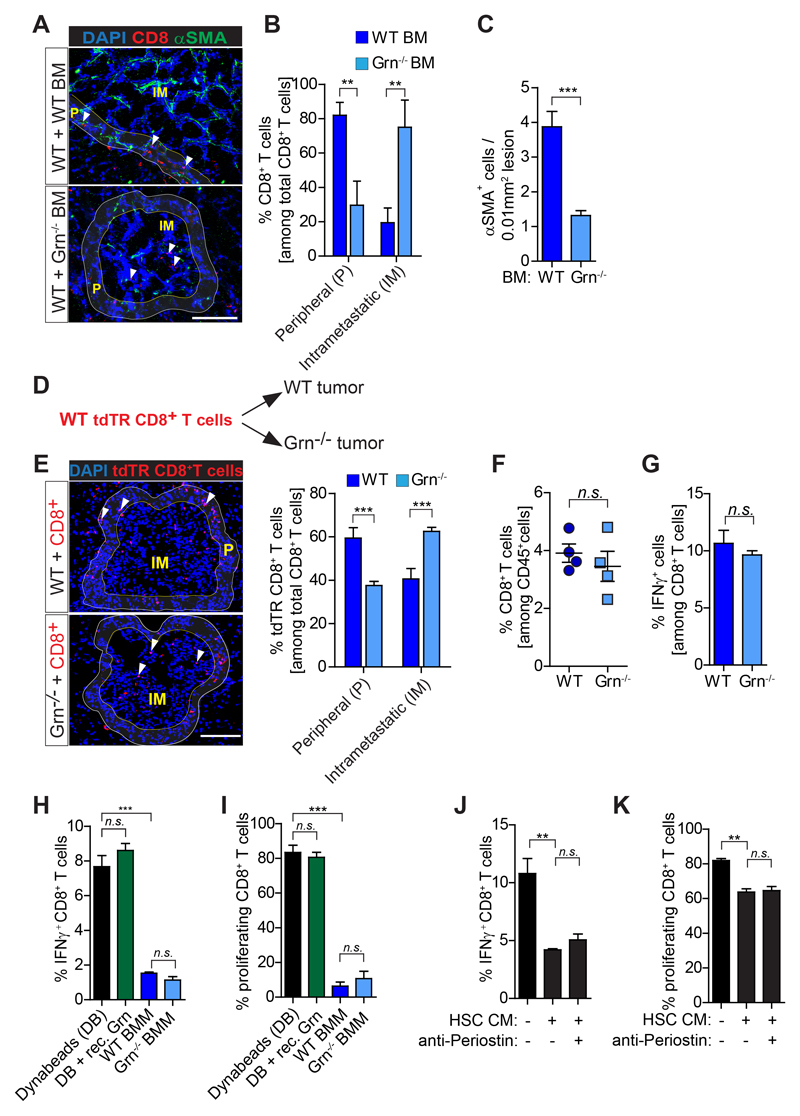
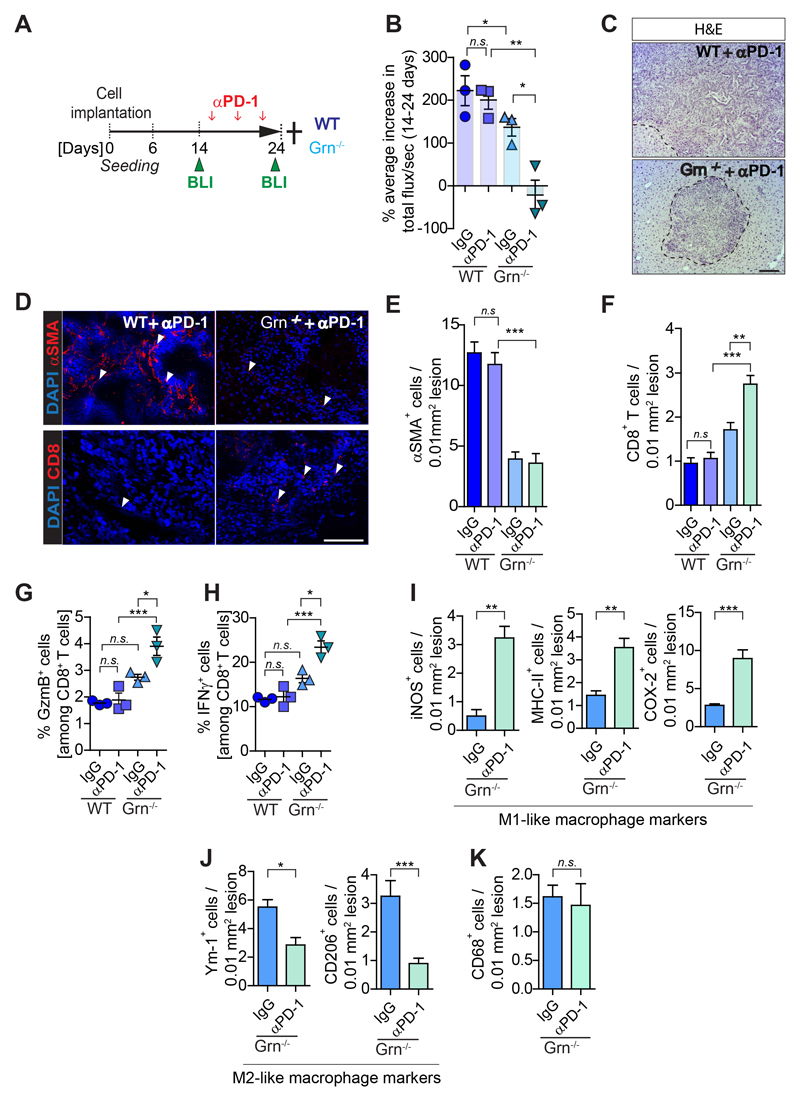
The ability of disseminated cancer cells to evade the immune response is a critical step for efficient metastatic progression. Protection against an immune attack is often provided by the tumor microenvironment that suppresses and excludes cytotoxic CD8+ T cells. Pancreatic ductal adenocarcinoma (PDAC) is a highly aggressive metastatic disease with unmet needs, yet the immunoprotective role of the metastatic tumor microenvironment in pancreatic cancer is not completely understood. In this study, we find that macrophage-derived granulin contributes to cytotoxic CD8+ T-cell exclusion in metastatic livers. Granulin expression by macrophages was induced in response to colony-stimulating factor 1. Genetic depletion of granulin reduced the formation of a fibrotic stroma, thereby allowing T-cell entry at the metastatic site. Although metastatic PDAC tumors are largely resistant to anti-PD-1 therapy, blockade of PD-1 in granulin-depleted tumors restored the antitumor immune defense and dramatically decreased metastatic tumor burden. These findings suggest that targeting granulin may serve as a potential therapeutic strategy to restore CD8+ T-cell infiltration in metastatic PDAC, thereby converting PDAC metastatic tumors, which are refractory to immune checkpoint inhibitors, into tumors that respond to immune checkpoint inhibition therapies.Significance: These findings uncover a mechanism by which metastatic PDAC tumors evade the immune response and provide the rationale for targeting granulin in combination with immune checkpoint inhibitors for the treatment of metastatic PDAC.Graphical Abstract: http://cancerres.aacrjournals.org/content/canres/78/15/4253/F1.large.jpg Cancer Res; 78(15); 4253-69. ©2018 AACR.


Conflict of interest statement

Conflict of interest statement: The authors declare no potential conflicts of interest.

Figures

Figure 1
Figure 1. CD8+ T cell infiltration and activation is lost during metastatic PDAC progression
(A-B) Immunohistochemistry images and quantification of cytokeratin (CK)+ metastatic cancer cells and cytotoxic T cells (CD8+) infiltration in human serial tissue sections (n = 10 metastatic PDAC; n = 5 healthy; each metastatic PDAC tissue section contained multiple lesions. Individual lesions were captured by one field of view (FoV). Dots represent the relationship between CD8+ T cell numbers and CK+ cell numbers in each lesion; (C-H) Liver metastasis was induced by intrasplenic implantation of KPCzsGreen/luc cancer cells. Livers were resected from metastatic mice after 6 and 14 days. (C-D) Individual lesions were captured by one FoV. Dots represent the relationship between CD8+ T cell numbers and KPCzsGreen/luc cancer cell numbers in each lesion (n=4 mice / time point, five FoV quantified / mouse) (E) Percentage of CD8+ T cells, (F) CD69+ CD8+ T cells, (G) and PD-1+ CD8+ T cells over time assessed by flow cytometry analysis. (H) Quantification of Tnfa and Gzmb mRNA levels in PD-1+ and PD-1neg CD8+ T cells isolated by fluorescence activated cell sorting (FACS) from livers resected at day 14. Scale bars = 100µm; ***, P<0.001; **, P < 0.01; *, P < 0.05; n.s., not significant, by unpaired t-test and/or Bonferroni multiple comparison.
Figure 2
Figure 2. Immune suppressive macrophages accumulate in established PDAC metastasis.
Liver metastasis was induced by intrasplenic implantation of KPC luc/zsGreen cancer cells. Livers were resected 6 and 14 days (n= 4 mice / time point) and analyzed. (A) Flow cytometry quantification of F480+ cells in naïve and metastatic resected livers. (B-C) M1 and M2-macrophage associated genes expression in FACS isolated MAMs by qPCR. (D) Immunohistochemistry images and quantification of M1-like MAM markers and (E) M2-like MAM markers. (F) Immunofluorescent images and quantification of RELMα+ M2-like macrophages clustering around metastatic PDAC cells (zsGreen+).(G-H) MAMs isolated from resected livers were tested for their ability to (G) suppress CD28/CD3 Dynabeads (DB) stimulated splenic CD8+ T cell proliferation (CFSE dilution) (H) and activation (IFNγ level) (data are mean ± SD of 4 independent experiments). Scale bars= 100µm; ***, P<0.001; **, P < 0.01; *, P < 0.05; n.s., not significant, by unpaired t-test and/or Bonferroni multiple comparison.
Figure 3
Figure 3. Pharmacological blockade of CSF-1 reprograms MAMs and reinvigorates CD8+ T cell functions
Liver metastasis was induced by intrasplenic implantation of KPCzsGreen/luc cells. After 7 days mice were treated with IgG control (Ctr) or αCSF-1 antibody. Metastatic livers were resected at day 20 and analyzed by haematoxylin and eosin (H&E) staining (n=6 mice/group) and by flow cytometry (n=4 mice/group). (A) Schematic illustration of the experiment. (B) H&E images and quantification. (C) Total and (D) M2-like (CD206+) MAMs. (E) M1-like and M2-like macrophage genes expression analysis in MAMs (F) Quantification of CD8+ T cells. (G) Representative dot plot and quantification of IFNγ levels in CD8+ T cells (n = 3 mice /group); Quantification of (H) Granzyme B+ (GzmB) cells, (I) proliferating (Ki67+) cells among total CD8+ T cells and among (J) PD-1+ CD8+ T cells. (K) Metastatic tumor burden in mice treated with αCD8 and αCSF-1 alone or in combination (n = 3 mice /group). Scale bars = 100µm; ***, P<0.001; **, P < 0.01; *, P < 0.05; n.s., not significant, by unpaired t-test and/or Bonferroni multiple comparison.
Figure 4
Figure 4. CSF-1 inhibition reduces desmoplasia and sensitizes metastatic PDAC to αPD-1 treatment
Liver metastasis was induced by intrasplenic implantation of KPCzsGreen/luc cells or Panc02zsGreen/luc cancer cells. Cohorts were treated with control IgG, αCSF-1 and αPD-1, alone or in combination. Treatment started at day 7 (d7) or at day 14 (d14) (n = 4 or 5 mice / group). (A) Schematic representation of the treatment regimen. (B) Percentage of average change in metastatic lesion area compared to control in response to treatment assessed by H&E staining at endpoint. (C) Immunohistochemistry images of CD8+ T cells and myofibroblasts (αSMA+) in human PDAC metastatic livers and quantification of perimetastatic (P) and intrametastatic (IM) CD8+ T cells (n= 6 patients). (D) Liver metastasis was induced by intrasplenic implantation of KPCzsGreen/luc cancer cells. Livers were resected after 6 and 14 days and assessed by αSMA+ (myofibroblasts), Picrosirius red (collagen deposition) and CD8+ T cell staining. (E-G) Images and relative quantification of (E) picrosirius red and H&E staining of sequential tumor sections showing area occupied by fibrotic stroma, (F) myofibroblasts (αSMA+, red) cell frequency and (G) infiltrating CD8+ T cells in liver tissue sections of mice treated at d14 with IgG control or αCSF-1. Quantification of staining is referred to metastatic tumor generated by KPC zsGreen/luc or Panc02 zsGreen/luc cancer cells implantation. Images are representative of KPC zsGreen/luc cancer cells derived liver metastatic lesions (n= 4 or 5 mice / group; additional treatment groups are shown in Supplementary Fig. S4). Scale bars= 100µm; ***, P<0.001; **, P < 0.01; *, P < 0.05; n.s., not significant, by unpaired t-test and/or Bonferroni multiple comparison.
Figure 5
Figure 5. Hypoxia amplifies CSF-1-induced granulin expression in macrophages
(A) Quantification of Granulin expression by qPCR in primary bone marrow derived macrophages (BMMs) unstimulated and exposed to recombinant CSF-1. (B) ELISA quantification of CSF-1 protein levels in conditioned medium (CM) generated from BMMs, and KPC and Panc02 pancreatic cancer cells. (C) Quantification of Granulin expression by qPCR in BMMs exposed to KPC and Panc02 conditioned media (CM) in the presence of IgG control (Ctr) or neutralizing αCSF-1 mAb. (D) Quantification of Granulin expression in MAMs from KPCzsGreen/luc induced metastatic tumors treated with IgG control (Ctr) or αCSF-1. (E) Immunohistochemistry images and quantification of granulin in KPCzsGreen/luc or Panc02 zsGreen/luc tumor bearing mice treated with IgG control (Ctr) or αCSF-1 (n = 4 mice). (F) Representative images and quantification of hypoxic areas surrounding metastatic KPCzsGreen/luc cells (zsGreen+) assessed by Hypoxyprobe™-1 (n= 3 mice / group). (G-H) ELISA quantification of (G) granulin protein level in unstimulated BMMs (Ctr), and BMMs exposed to recombinant murine CSF-1 or DMOG for 24 hours and (H) granulin protein level in BMMs cultured for 24 hours under normoxic and hypoxic conditions in presence or absence of recombinant murine CSF-1. In A-C, G-H data are mean ± SD of 3 independent experiments. Scale bars= 100µm; ***, P<0.001; **, P < 0.01; *, P < 0.05; n.s., not significant, by unpaired t-test.
Figure 6
Figure 6. CD8+T cells intra-metastatic infiltration but not activity is increased in granulin depleted mice
(A-C) Liver metastasis was induced by intrasplenically implantation of KPC cells into chimeric WT+ WT BM and WT+ Grn-/- BM mice. Entire livers were resected 14 days later and analyzed. (A) Immunofluorescence images of CD8+ T cells and αSMA+ myofibroblasts. Intrametastatic (IM) and peripheral areas (P) are indicated. (B) Quantification of peripheral (P) and intrametastatic (IM) CD8+ T cells. (C) Quantification of αSMA+ cells (WT BM, n= 5; Grn-/- BM, n= 6). (D-E) Adoptive transfer of tdTR CD8+ T cells into metastasis bearing WT and Grn-/- mice (D) Schematic illustration of the experiment. (E) Immunofluorescence images and quantification of tdTR CD8+ T cells (red) in perimetastatic (P) and intrametastatic (IM) regions (n= 3 mice / group). (F-G) KPC cells were intrasplenically implanted in mice to induce liver metastasis in WT and Grn-/- mice. Livers were resected after 14 days and analyzed (n= 4 WT and n= 4 Grn-/- mice). (F) Flow cytometry quantification of CD8+ T cell number and (G) IFNγ+ CD8+ T cell. (H-I) Bone marrow isolated macrophages (BMMs) derived from WT and Grn-/- mice and recombinant granulin (rec. Grn) were tested for the capacity of suppress splenic CD8+ T cell (H) activation (IFNγ expression levels) and (I) proliferation (CFSE dilution). (J-K) Conditioned medium (CM) generated from activated hepatic stellate cells (HSC) was used to validate the (J) activation (IFNγ expression levels) and (K) proliferation (CFSE dilution) of splenic CD8+ T cell in the presence or absence of a periostin neutralizing antibody. In H-K data are mean ± SD of 3 independent experiments. Scale bars= 100µm; ***, P<0.001; **, P < 0.01; *, P < 0.05; n.s., not significant, by unpaired t-test and/or Bonferroni multiple comparison.
Figure 7
Figure 7. Depletion of granulin restores response of metastatic PDAC to αPD-1 therapy
Liver metastasis was induced by intrasplenic implantation of KPCzsGreen/luc cells in WT and Grn-/- mice. Mice were treated with control IgG or αPD-1. Change in tumor burden was quantified by in vivo BLI. (n= 3 mice/group). (A) Schematic illustration of the experiment. (B) Change in metastatic tumor burden (total flux/sec). (C) H&E images of αPD-1 treated cohorts. Metastatic lesions are delineated with dashed lines. (D) Immunofluorescence images of myofibroblasts (αSMA+) and CD8+ T cell staining of sequential liver sections from WT and Grn-/- mice treated with αPD-1. (E-F) Quantification of myofibroblasts (αSMA+) accumulation and CD8+ T cell infiltration as described in D. Quantifications of (G) Granzyme B (GzmB+) and (H) IFNγ+ CD8+ T cells by flow cytometry analysis. (I-K) Immunohistochemistry images and quantification of cells positive for (I) pro-inflammatory M1-like (iNOS, MHC-II, COX-2) MAMs, (J) anti-inflammatory M2-like (Ym-1, CD206) MAMs and (K) total (CD68) MAMs markers. Scale bars= 100µm; ***, P<0.001; **, P < 0.01; *, P < 0.05; n.s., not significant, by unpaired t-test and/or Bonferroni multiple comparison.

References

    1. Chen DS, Mellman I. Oncology meets immunology: the cancer-immunity cycle. Immunity. 2013;39(1):1–10. - PubMed
    1. Fridman WH, Pages F, Sautes-Fridman C, Galon J. The immune contexture in human tumours: impact on clinical outcome. Nature reviews Cancer. 2012;12(4):298–306. - PubMed
    1. Fukunaga A, Miyamoto M, Cho Y, Murakami S, Kawarada Y, Oshikiri T, et al. CD8+ tumor-infiltrating lymphocytes together with CD4+ tumor-infiltrating lymphocytes and dendritic cells improve the prognosis of patients with pancreatic adenocarcinoma. Pancreas. 2004;28(1):e26–31. - PubMed
    1. Galon J, Costes A, Sanchez-Cabo F, Kirilovsky A, Mlecnik B, Lagorce-Pages C, et al. Type, density, and location of immune cells within human colorectal tumors predict clinical outcome. Science. 2006;313(5795):1960–4. - PubMed
    1. Ribas A. Tumor immunotherapy directed at PD-1. The New England journal of medicine. 2012;366(26):2517–9. - PubMed

Publication types

MeSH terms