. 2018 Jul;177(3):1319-1338.
doi: 10.1104/pp.18.00055. Epub 2018 May 22.

Molecular Mechanisms Preventing Senescence in Response to Prolonged Darkness in a Desiccation-Tolerant Plant

Affiliations

Molecular Mechanisms Preventing Senescence in Response to Prolonged Darkness in a Desiccation-Tolerant Plant

Meriem Durgud et al. Plant Physiol. 2018 Jul.

Abstract

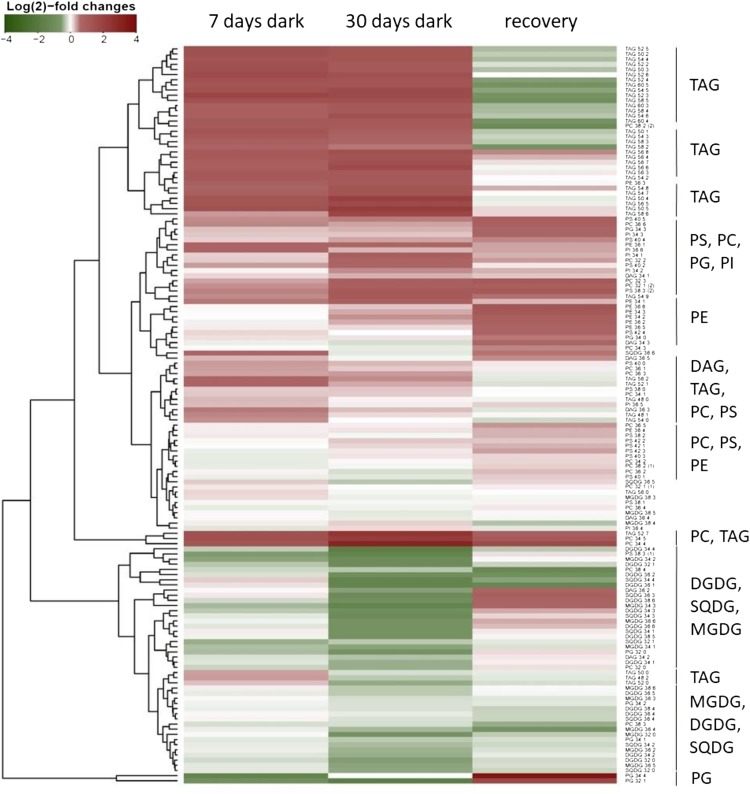
The desiccation-tolerant plant Haberlea rhodopensis can withstand months of darkness without any visible senescence. Here, we investigated the molecular mechanisms of this adaptation to prolonged (30 d) darkness and subsequent return to light. H. rhodopensis plants remained green and viable throughout the dark treatment. Transcriptomic analysis revealed that darkness regulated several transcription factor (TF) genes. Stress- and autophagy-related TFs such as ERF8, HSFA2b, RD26, TGA1, and WRKY33 were up-regulated, while chloroplast- and flowering-related TFs such as ATH1, COL2, COL4, RL1, and PTAC7 were repressed. PHYTOCHROME INTERACTING FACTOR4, a negative regulator of photomorphogenesis and promoter of senescence, also was down-regulated. In response to darkness, most of the photosynthesis- and photorespiratory-related genes were strongly down-regulated, while genes related to autophagy were up-regulated. This occurred concomitant with the induction of SUCROSE NON-FERMENTING1-RELATED PROTEIN KINASES (SnRK1) signaling pathway genes, which regulate responses to stress-induced starvation and autophagy. Most of the genes associated with chlorophyll catabolism, which are induced by darkness in dark-senescing species, were either unregulated (PHEOPHORBIDE A OXYGENASE, PAO; RED CHLOROPHYLL CATABOLITE REDUCTASE, RCCR) or repressed (STAY GREEN-LIKE, PHEOPHYTINASE, and NON-YELLOW COLORING1). Metabolite profiling revealed increases in the levels of many amino acids in darkness, suggesting increased protein degradation. In darkness, levels of the chloroplastic lipids digalactosyldiacylglycerol, monogalactosyldiacylglycerol, phosphatidylglycerol, and sulfoquinovosyldiacylglycerol decreased, while those of storage triacylglycerols increased, suggesting degradation of chloroplast membrane lipids and their conversion to triacylglycerols for use as energy and carbon sources. Collectively, these data show a coordinated response to darkness, including repression of photosynthetic, photorespiratory, flowering, and chlorophyll catabolic genes, induction of autophagy and SnRK1 pathways, and metabolic reconfigurations that enable survival under prolonged darkness.


Figures

Figure 1.
Figure 1.
H. rhodopensis can survive long-term darkness without visible damage. A, Plants grown under the photoperiodic condition (16 h of light/8 h of dark) for up to 37 d. B, Plants kept in darkness for up to 1 month and then transferred to light (16-h-light/8-h-dark photoperiod) for 7 d (recovery).
Figure 2.
Figure 2.
Darkness does not cause cell damage and significant chlorophyll loss in H. rhodopensis. A, Chlorophyll content in H. rhodopensis leaves during dark treatment and subsequent recovery. Data are means of 15 individual plants from three biological replicates. Error bars indicate sd. Asterisks indicate statistically significant differences from the respective light controls (P < 0.05, Student’s t test). FW, Fresh weight. B, Conductivity of H. rhodopensis leaves during dark treatment and subsequent recovery. Data are means of three biological replicates. Error bars indicate sd.
Figure 3.
Figure 3.
H. rhodopensis can tolerate desiccation in darkness. A, Phenotypes of hydrated and desiccated H. rhodopensis plants grown in the photoperiod (light) or in darkness. B, RWC of hydrated and desiccated H. rhodopensis plants grown in the photoperiod or in darkness. C, Electrolyte leakage (conductivity) of hydrated and desiccated H. rhodopensis plants grown in the photoperiod or in darkness. Data are means of three biological replicates. Error bars indicate sd.
Figure 4.
Figure 4.
Species distribution of top BLASTX hits of H. rhodopensis transcripts against the NCBI nr database. H. rhodopensis transcripts were computationally translated into all possible protein sequences and compared with protein sequences in the NCBI nr database using BLASTX. The pie chart shows the percentages of the best BLAST hits from different species.
Figure 5.
Figure 5.
DEGs in at least one of the three conditions (7 d of darkness, 30 d of darkness, and recovery from darkness). A, Values plotted are log2 fold change, where T0 values = 0. Values are statistically significant (P < 0.05, Student’s t test). B, Venn diagram of up-regulated DEGs, C, Venn diagram of down-regulated DEGs.
Figure 6.
Figure 6.
Differentially expressed TF genes in at least one of the three conditions (7 d of darkness, 30 d of darkness, and recovery from darkness). Values plotted are log2 fold change, where T0 values = 0.
Figure 7.
Figure 7.
Expression of key genes representing pathways significantly regulated during long-term darkness and subsequent recovery in H. rhodopensis. Magenta and green depict gene induction and repression, respectively, compared with the control plants grown under the photoperiod and measured at the same time points. The data are means of three biological replicates.
Figure 8.
Figure 8.
Changes in metabolite abundances of H. rhodopensis leaves during darkness and subsequent recovery. Green and magenta depict decreases and increases, respectively, in contents of metabolites (fold change, compared with the control plants grown under the photoperiod and sampled at the same time points). The data are means of six biological replicates.
Figure 9.
Figure 9.
Major metabolic alterations of H. rhodopensis in response to long-term darkness and subsequent recovery. Blue and red depict decreases and increases in the content of metabolites, respectively (fold change, compared with the respective photoperiod controls). The data in the boxes are presented from left to right as follows: unstressed plants, 7 d of darkness, 30 d of darkness, and recovered plants. Statistical analysis was performed using Student’s t test (P < 0.05). The data are means of six biological replicates. GABA, γ-Aminobutyric acid; PEP, phosphoenolpyruvate.
Figure 10.
Figure 10.
Changes in lipid abundances of H. rhodopensis leaves during darkness and subsequent recovery. Green and red depict decreases and increases, respectively, in lipid content. Values plotted are log2 fold change, where T0 values = 0. DAG, Diacylglycerol; PE, phosphatidylethanolamine; PI, phosphatidylinositol; PS, phosphatidylserine. The data are means of six biological replicates.

References

    1. Altschul SF, Gish W, Miller W, Myers EW, Lipman DJ (1990) Basic local alignment search tool. J Mol Biol 215: 403–410 - PubMed
    1. Araújo WL, Ishizaki K, Nunes-Nesi A, Larson TR, Tohge T, Krahnert I, Witt S, Obata T, Schauer N, Graham IA, et al. (2010) Identification of the 2-hydroxyglutarate and isovaleryl-CoA dehydrogenases as alternative electron donors linking lysine catabolism to the electron transport chain of Arabidopsis mitochondria. Plant Cell 22: 1549–1563 - PMC - PubMed
    1. Araújo WL, Ishizaki K, Nunes-Nesi A, Tohge T, Larson TR, Krahnert I, Balbo I, Witt S, Dörmann P, Graham IA, et al. (2011) Analysis of a range of catabolic mutants provides evidence that phytanoyl-coenzyme A does not act as a substrate of the electron-transfer flavoprotein/electron-transfer flavoprotein:ubiquinone oxidoreductase complex in Arabidopsis during dark-induced senescence. Plant Physiol 157: 55–69 - PMC - PubMed
    1. Avin-Wittenberg T, Bajdzienko K, Wittenberg G, Alseekh S, Tohge T, Bock R, Giavalisco P, Fernie AR (2015) Global analysis of the role of autophagy in cellular metabolism and energy homeostasis in Arabidopsis seedlings under carbon starvation. Plant Cell 27: 306–322 - PMC - PubMed
    1. Baena-González E, Sheen J (2008) Convergent energy and stress signaling. Trends Plant Sci 13: 474–482 - PMC - PubMed

Publication types

LinkOut - more resources