. 2018 May 22;9(1):1932.
doi: 10.1038/s41467-018-03143-w.

Rapid host strain improvement by in vivo rearrangement of a synthetic yeast chromosome

Affiliations

Rapid host strain improvement by in vivo rearrangement of a synthetic yeast chromosome

B A Blount et al. Nat Commun. .

Abstract

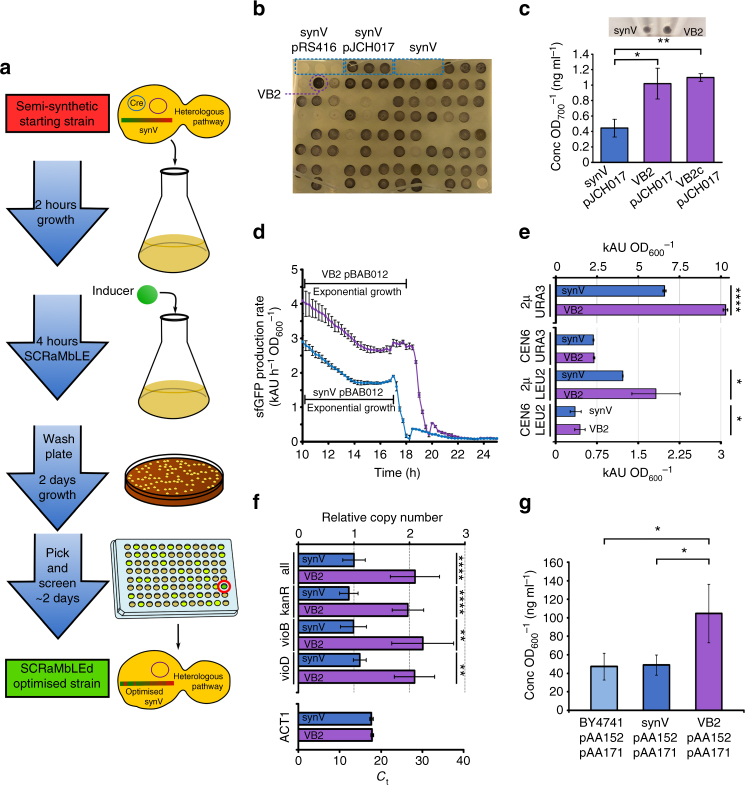
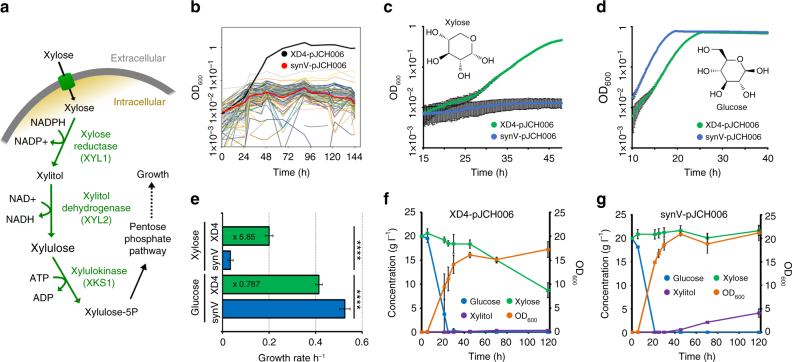
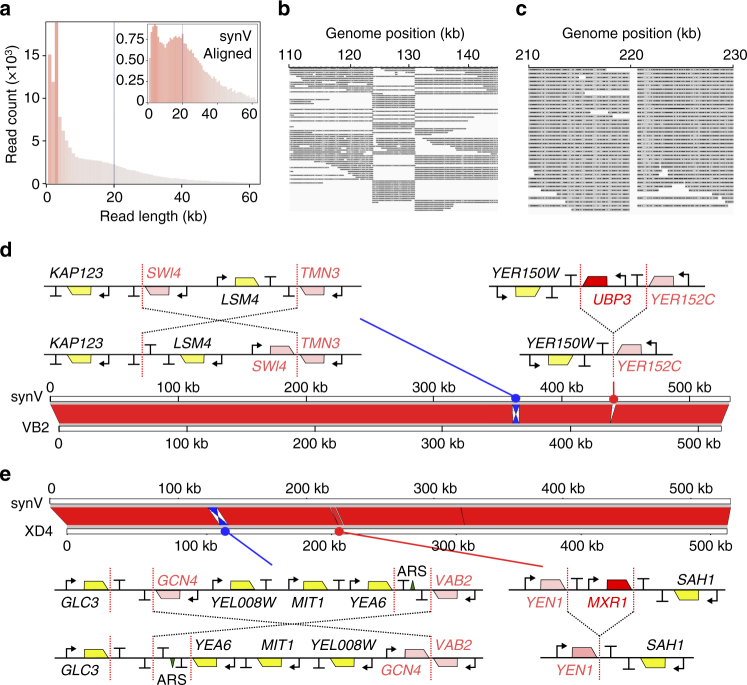
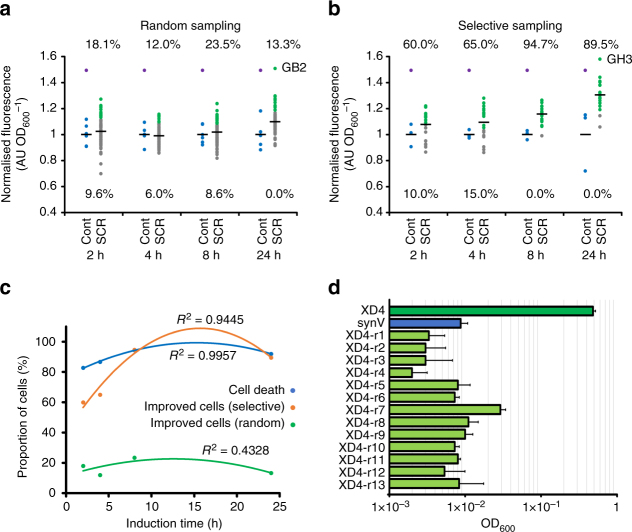
Synthetic biology tools, such as modular parts and combinatorial DNA assembly, are routinely used to optimise the productivity of heterologous metabolic pathways for biosynthesis or substrate utilisation, yet it is well established that host strain background is just as important for determining productivity. Here we report that in vivo combinatorial genomic rearrangement of Saccharomyces cerevisiae yeast with a synthetic chromosome V can rapidly generate new, improved host strains with genetic backgrounds favourable to diverse heterologous pathways, including those for violacein and penicillin biosynthesis and for xylose utilisation. We show how the modular rearrangement of synthetic chromosomes by SCRaMbLE can be easily determined using long-read nanopore sequencing and we explore experimental conditions that optimise diversification and screening. This synthetic genome approach to metabolic engineering provides productivity improvements in a fast, simple and accessible way, making it a valuable addition to existing strain improvement techniques.


Conflict of interest statement

The authors declare no competing financial interests.

Figures

Fig. 1
Fig. 1
Optimising a synV host by SCRaMbLE for enhanced violacein production. a The workflow of a SCRaMbLE host optimisation process. b Eighty seven post-SCRaMbLE synV-pJCH017 colonies and synV, synV-pRS416 and synV-pJCH017 controls were grown in liquid culture, spotted onto SDO URA agar medium and grown for 2 days. The best performing strain, VB2, is highlighted. c Results of colourimetric determination of violacein yields from synV-pJCH017, VB2-pJCH017 and VB2c-pJCH017 cultures, n = 3. Inset are microtubes in which equal volumes of synV-pJCH017 and VB2-pJCH017 culture, normalised for OD700, have been pelleted by centrifugation. d sfGFP production rates from synV-pBAB012 and VB2-pBAB012 cultures, n ≥ 7. Data shown are the increase in 520 nm fluorescence value over the previous hour normalised to the OD600 value at the midpoint of that hour. e The 520 nm fluorescence levels of cultures of synV and VB2 strains containing pBAB011 (CEN6/URA3), pBAB012 (2μ/URA3), pBAB015 (CEN6/LEU2) or pBAB016 (2μ/LEU2) plasmids after 29.5 h of growth. Fluorescence values are normalised for OD600, n ≥ 7. f qPCR evaluation of pJCH017 copy number in total DNA preparations from stationary synV-pJCH017 and VB2-pJCH017 cultures. The vioD, vioB and kanR targets are located on pJCH017 and 'all' represents the combined data from amplification of these three loci. Relative copy number is the calculated concentration of pJCH017 in the total DNA for each experiment normalised to the combined synV-pJCH017 value. The ACT1 control shows the threshold cycle for amplification of a chromosomal ACT1 target for each DNA preparation, demonstrating equal levels of genomic DNA, n = 6 (2 technical replicates each of 3 biological replicates). g The amount of penicillin G secreted by BY4741-pAA152/171, synV-pAA152/171 and VB2-pAA152/171 strains as determined by LC-MS. Values are normalised for OD600, n = 3. All values plotted are mean averages and error bars represent 1 standard deviation from the mean. Replicate numbers represent biological replicates except where otherwise stated. Asterisks denote two-tail p-value as determined by two-sample t-test, with *p ≤ 0.05, **p ≤ 0.01, and ****p ≤ 0.0001
Fig. 2
Fig. 2
SCRaMbLE generates a host strain specialised for xylose utilisation. a Xylose oxidoreductase pathway through which xylose is converted to xylulose-5 phosphate before entering the pentose phosphate pathway. Enzymes with names in green are encoded by genes on pJCH006. b OD600 values for the initial 96-well based screening of colonies in SCX URA medium. The synV-pJCH006 control and the colony in well D4 are highlighted, n = 1. c The growth of XD4-pJCH006 and synV-pJCH006 in synthetic xylose medium over 48 h in 96-well format, n = 19. d The growth of XD4-pJCH006 and synV-pJCH006 in synthetic glucose medium over 48 h in 96-well format, n ≥ 18. e The growth rate per hour of XD4-pJCH006 and synV-pJCH006 in synthetic xylose and synthetic glucose media in 96-well format. Rates were calculated over 5 h of exponential growth, n ≥ 18. f HPLC-derived concentrations of glucose, xylose and xylitol and the optical density (OD600) of 25 ml XD4-pJCH006 cultures in SC URA medium with 2% glucose and 2% xylose over time, n = 2. g The equivalent data derived from synV-pJCH006 cultures, n = 2. All values plotted are mean averages and error bars represent 1 standard deviation from the mean. Replicate numbers represent biological replicates. Asterisks denote two-tail p-value as determined by two-sample t-test, with ****p ≤ 0.0001
Fig. 3
Fig. 3
Nanopore sequencing to identify the SCRaMbLE events in enhanced strains. a Base-called read length distribution of the XD4 nanopore sequencing run. The line at 20 kbp indicates the DNA shear length during library preparation. Inset is the same analysis of the subset of the data that aligned by LAST to the synthetic chromosome V sequence. b An alignment of XD4 nanopore sequencing reads to parental synV sequence around the identified inversion region. c An alignment of XD4 nanopore sequencing reads to parental synV sequence around the identified MXR1 deletion region. d Full alignment of the VB2 contig, and e the alignment of the XD4 contig to the parental synV. The inversion and deletion regions are expanded to show diagrammatic interpretations of the SCRaMbLE events, showing pre- (top) and post-SCRaMbLE (bottom) configurations, with locations of promoters (arrows), coding sequences (polygons), terminators (T), autonomous replicating sequences (ARS, triangle) and loxPsym sites (red dotted lines) indicated. Red coding sequences are deleted by SCRaMbLE events and pink coding sequences have their 3′ UTR regions altered
Fig. 4
Fig. 4
Investigating the dynamics of SCRaMbLE. a The endpoint 520 nm fluorescence values of SCRaMbLEd synV-pBAB016 colonies picked randomly after 2, 4, 8 or 24 h of β-estradiol induction and then grown in 96-well plate format for 24 h. For each induction length, ≥81 randomly selected induced colonies were characterised and 6 colonies were also characterised from an uninduced synV-pBAB016 control plate. Fluorescence values were normalised for culture OD600 and are given as a proportion of the mean un-SCRaMbLEd control fluorescence value for that induction length. Blue dots denote un-SCRaMbLEd controls (cont), grey dots denote SCRaMbLEd cells (SCR) that have a fluorescence value equal to or lower than the highest un-SCRaMbLEd control, green dots denote SCRaMbLEd cells that have a higher fluorescence values than any of the un-SCRaMbLEd controls and purple dots denote the relative VB2-pBAB016 fluorescence value from Fig. 1e. Percentage values above the plotted data are the proportion of SCRaMbLEd cells that have a higher fluorescence value than any of the un-SCRaMbLEd controls and values below the plotted data give the proportion of SCRaMbLEd cells with a lower fluorescence value than those controls. Black horizontal lines denote the mean average relative fluorescence of that group of cells, excluding the VB2-pBAB016 value in the case of the controls. b The equivalent information but with SCRaMbLEd colonies visually screened under blue light to selectively pick colonies with high fluorescence. For each induction length, ≥19 selected colonies were characterised along with 3 un-SCRaMbLEd controls. c For each induction length, the proportion of cell death and the proportion of improved cultures, i.e., those with higher fluorescence output than any of the equivalent un-SCraMbLEd controls, with either selective or random picking of colonies. Lines are second-degree polynomial curves of best fit, with R2 values stated. d OD600 achieved after 48 h growth in synthetic xylose medium of XD4-pJCH006, synV-pJCH006 and the 13 fastest growing re-SCRaMbLEd XD4-pJCH006 colonies. Values plotted are mean averages of 3 biological replicates and error bars represent 1 standard deviation from the mean

Comment in

References

    1. Na D, Kim TY, Lee SY. Construction and optimization of synthetic pathways in metabolic engineering. Curr. Opin. Microbiol. 2010;13:363–370. doi: 10.1016/j.mib.2010.02.004. - DOI - PubMed
    1. Smanski MJ, et al. Synthetic biology to access and expand nature’s chemical diversity. Nat. Rev. Microbiol. 2016;14:135–149. doi: 10.1038/nrmicro.2015.24. - DOI - PMC - PubMed
    1. Keasling JD. Synthetic biology and the development of tools for metabolic engineering. Metab. Eng. 2012;14:189–195. doi: 10.1016/j.ymben.2012.01.004. - DOI - PubMed
    1. Tyo KE, Alper HS, Stephanopoulos GN. Expanding the metabolic engineering toolbox: more options to engineer cells. Trends Biotechnol. 2007;25:132–137. doi: 10.1016/j.tibtech.2007.01.003. - DOI - PubMed
    1. Keasling JD. Manufacturing molecules through metabolic engineering. Science. 2010;330:1355–1358. doi: 10.1126/science.1193990. - DOI - PubMed

Publication types

MeSH terms