. 2018 May 22;9(6):602.
doi: 10.1038/s41419-018-0595-9.

Long non-coding RNA Gm2199 rescues liver injury and promotes hepatocyte proliferation through the upregulation of ERK1/2

Affiliations

Long non-coding RNA Gm2199 rescues liver injury and promotes hepatocyte proliferation through the upregulation of ERK1/2

Qiang Gao et al. Cell Death Dis. .

Abstract

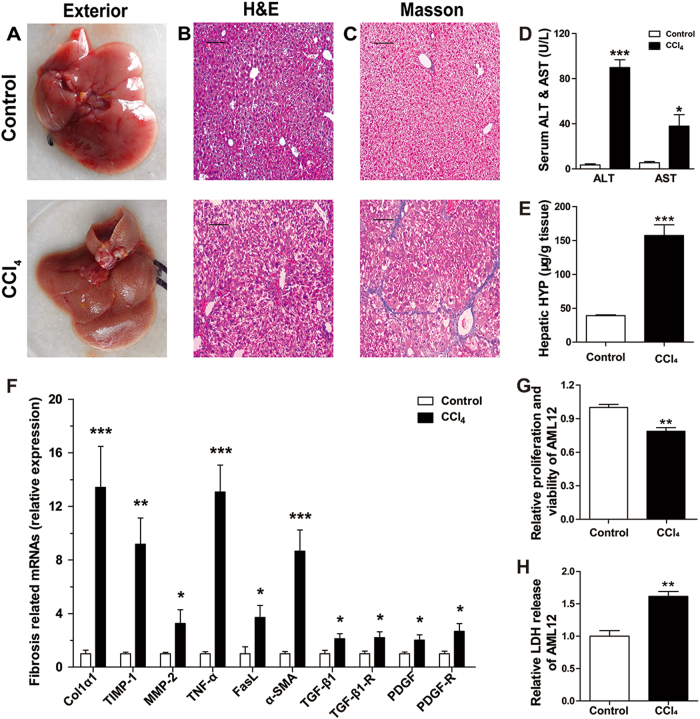
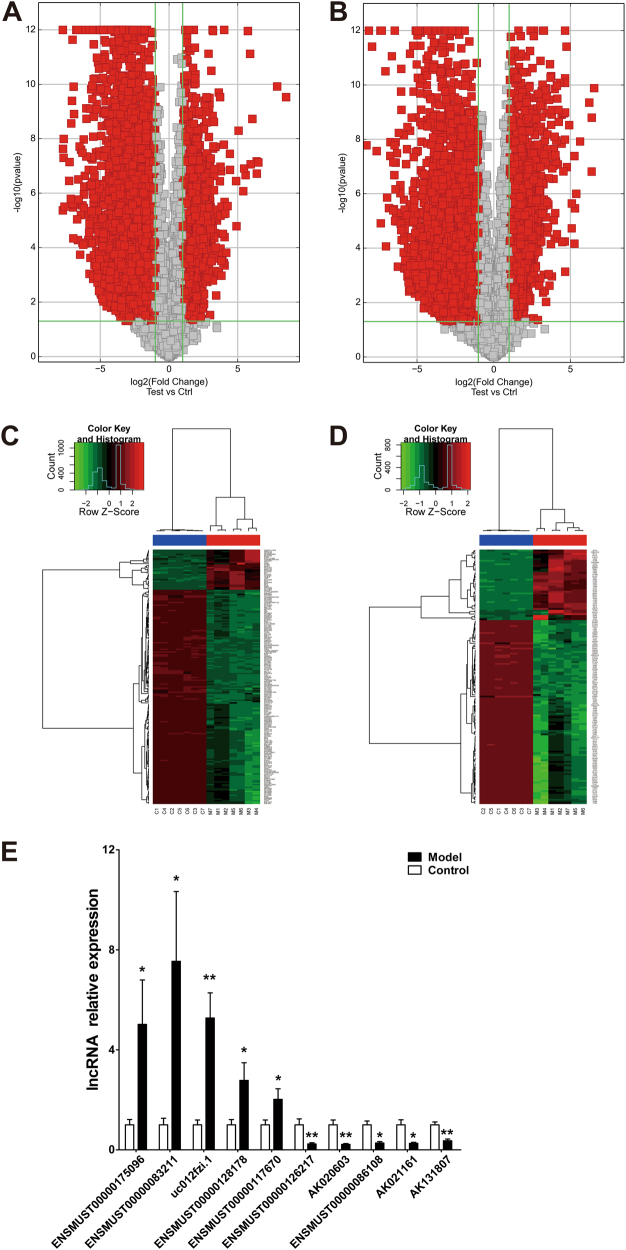
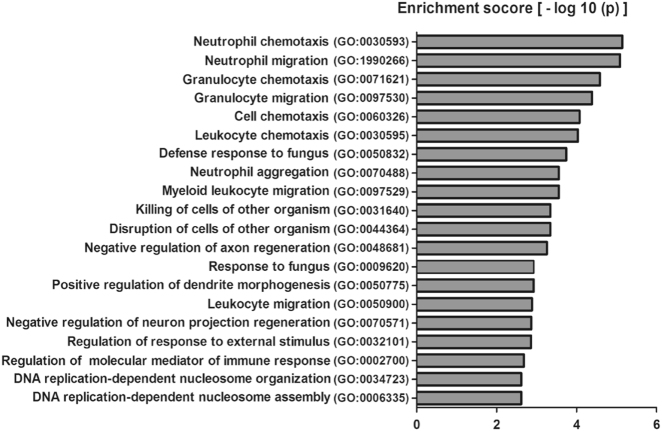
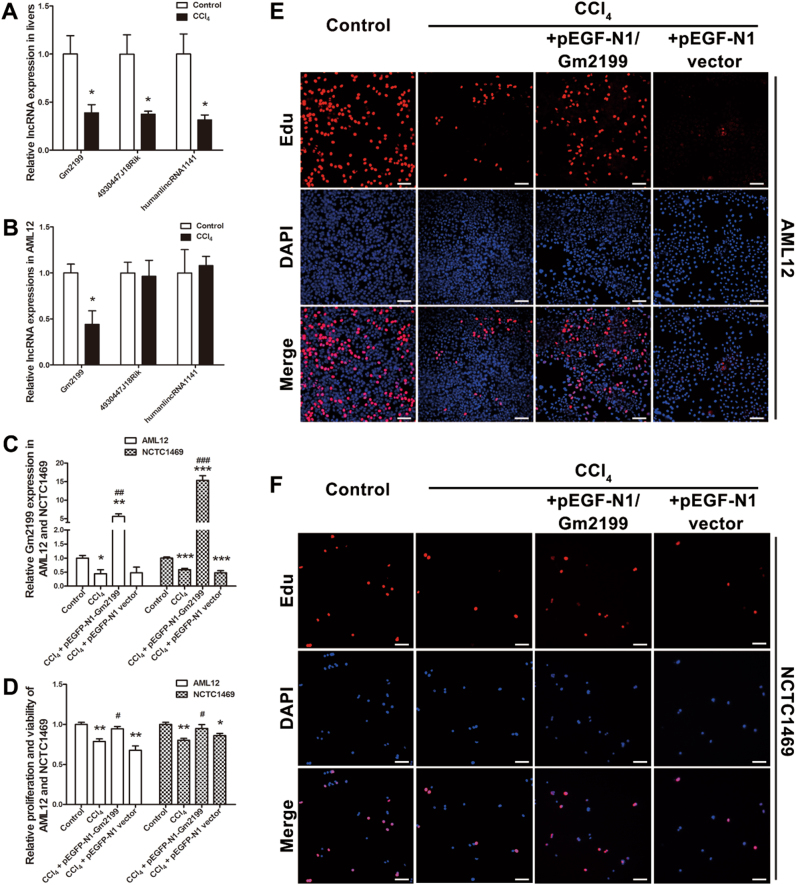
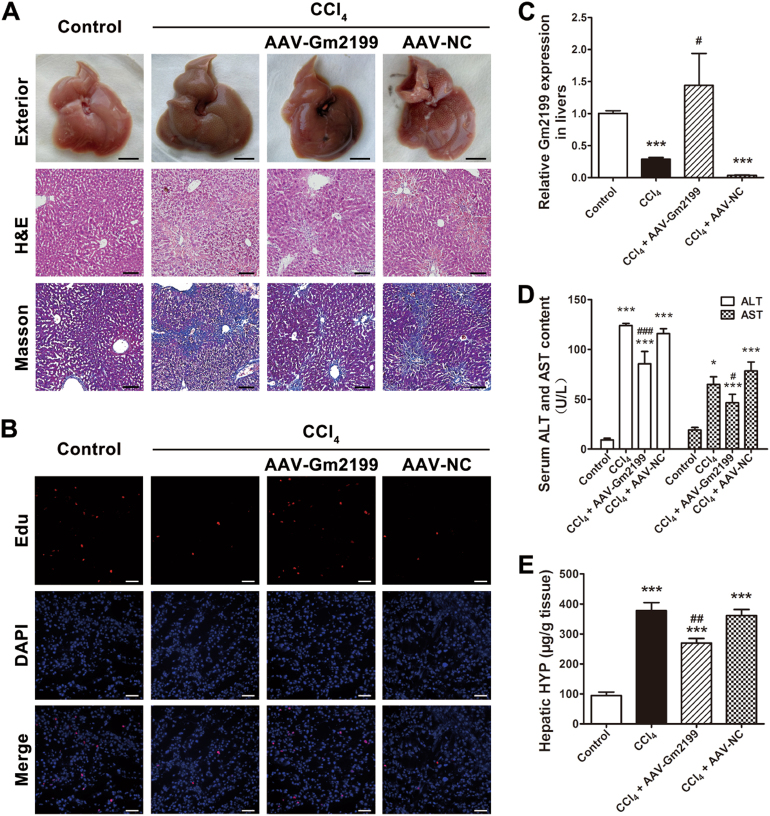
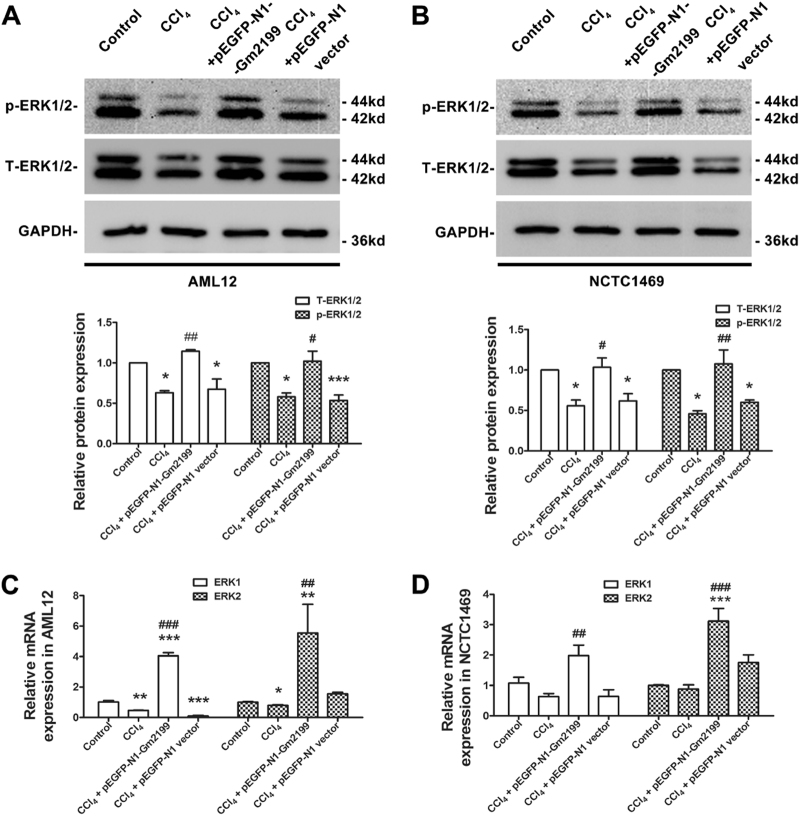
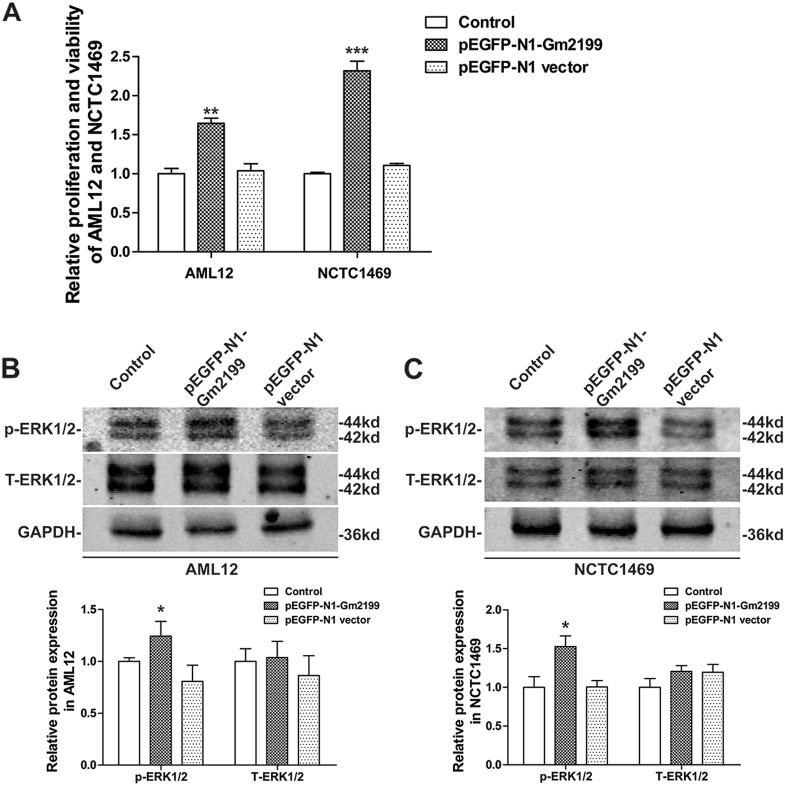
Long non-coding RNAs (lncRNAs) are a new class of regulators of various human diseases. This study was designed to explore the potential role of lncRNAs in experimental hepatic damage. In vivo hepatic damage in mice and in vitro hepatocyte damage in AML12 and NCTC1469 cells were induced by carbon tetrachloride (CCl4) treatments. Expression profiles of lncRNAs and mRNAs were analyzed by microarray. Bioinformatics analyses were conducted to predict the potential functions of differentially expressed lncRNAs with respect to hepatic damage. Overexpression of lncRNA Gm2199 was achieved by transfection of the pEGFP-N1-Gm2199 plasmid in vitro and adeno-associated virus-Gm2199 in vivo. Cell proliferation and viability was detected by cell counting kit-8 and 5-ethynyl-2'-deoxyuridine assay. Protein and mRNA expressions of extracellular signal-regulated kinase-1/2 (ERK1/2) were detected by western blot and quantitative real-time reverse-transcription PCR (qRT-PCR). Microarray analysis identified 190 and 148 significantly differentially expressed lncRNAs and mRNAs, respectively. The analyses of lncRNA-mRNA co-expression and lncRNA-biological process networks unraveled potential roles of the differentially expressed lncRNAs including Gm2199 in the pathophysiological processes leading to hepatic damage. Gm2199 was downregulated in both damaged livers and hepatocyte lines. Overexpression of Gm2199 restored the reduced proliferation of damaged hepatocyte lines and increased the expression of ERK1/2. Overexpression of Gm2199 also promoted the proliferation and viability of normal hepatocyte lines and increased the level of p-ERK1/2. Overexpression of Gm2199 in vivo also protected mouse liver injury induced by CCl4, evidenced by more proliferating hepatocytes, less serum alanine aminotransferase, less serum aspartate aminotransferase, and decreased hepatic hydroxyproline. The ability of Gm2199 to maintain hepatic proliferation capacity indicates it as a novel anti-liver damage lncRNA.


Conflict of interest statement

The authors declare that they have no conflict of interest.

Figures

Fig. 1
Fig. 1. Characterization of mouse model of in vivo hepatic damage induced by injection of CCl4 for 3 weeks, and of in vitro hepatocyte damage induced by CCl4 for 24 h.
a Comparison of the exterior appearance of livers between the CCl4 and control groups; (b) comparison of H&E staining of liver section between the CCl4 and control groups showing the differences of hepatic architecture; (c) comparison of Masson trichrome staining of liver section between the CCl4 and control groups showing the differences of hepatic fibrosis; the scale bars represent 10 μm. d Comparison of the contents of serum ALT and AST between the CCl4 and control groups. N = 7 for each group. e Comparison of the contents of hepatic HYP between the CCl4 and control groups. N = 7 for each group. f Alterations of expression levels of the genes related to hepatic damages in CCl4-treated mice compared with the control animals, as determined by qRT-PCR. The genes detected included Col1α1, α-SMA, TIMP-1, MMP-2, TNF-α, and TGF-β1. N = 7 for each group. g The relative cellular proliferation and viability was measured by CCK-8 assay in normal control and damaged AML12 induced by CCl4. N = 3 for each group. h Relative LDH release in normal control and CCl4-treated AML12. N = 3 for each group. All of the data were expressed as mean ± SEM. *P < 0.05, **P < 0.01, and ***P < 0.001 vs. control
Fig. 2
Fig. 2. Microarray analysis for identification of differentially expressed lncRNAs and mRNAs between damaged livers and healthy controls.
a Volcano plot of differentially expressed lncRNAs between hepatic damage models and controls. N = 7 for each group. b Volcano plot of differentially expressed mRNAs between CCl4 and control groups. N = 7 for each group. Two longitudinal green lines are fold change lines in a and b. Red symbols indicate downregulation >50% (left) or upregulation >2.0-fold change (right) in CCl4-treated mice relative to the control counterparts. The horizontal green line represents P < 0.05. Ctrl and Test represent control and CCl4 groups, respectively. c The Hierarchical clustering heatmap of differentially expressed lncRNAs between damaged livers and healthy controls. N = 7 for each group. d The Hierarchical clustering heatmap of differentially expressed mRNAs between damaged livers and healthy controls. Red color indicates high relative expression, and green indicates low relative expression. N = 7 for each group. C represents control group, and M represents CCl4 group. e Verification of microarray results with qRT-PCR. N = 3 for each group. *P < 0.05 and **P < 0.01 vs. control
Fig. 3
Fig. 3. GO analysis for the potential biological functions of the differentially expressed mRNAs in hepatic damage.
The chart shows the top 20 counts of the significant enrichment terms
Fig. 4
Fig. 4. Network analysis for the potential functions of differentially expressed lncRNAs in damaged livers.
a The co-expression network of differentially expressed lncRNAs and mRNAs. b The network of differentially expressed lncRNAs and biological process (BP) terms of their specific target genes. A round node represents a lncRNA, a hexagon node an mRNA, and a yellow rectangle node a BP term. Red color indicates upregulation and green downregulation. Solid lines represent positive correlation, and dash lines negative correlation. The width of the solid lines corresponds to −log10 (p)
Fig. 5
Fig. 5. Rescuing role of lncRNA Gm2199 in hepatic damages.
a Expression downregulation of three lncRNAs, Gm2199, 4930447J18Rik, and humanlincRNA1141, in mice with liver damages induced by CCl4. The lncRNAs under study were selected from the differentially expressed lncRNA in hepatic damage, which were bioinformatically predicted to be involved in the regulation of liver damage related signaling pathways. The transcript levels were determined by qRT-PCR. N = 5 for each group. b Alterations of the expression of Gm2199, 4930447J18Rik, and humanlincRNA1141 in a mouse hepatocyte line, AML12. Hepatic damage was induced by pretreating AML12 cells with 15 mmol/L CCl4 for 12 h. Note that only Gm2199 was found significantly downregulated in hepatic damage in vitro. N = 3 for each group. c The verification of overexpression of Gm2199 in AML12 and NCTC1469 cells transfected with pEGFP-N1-Gm2199 plasmid. N = 3 for each group. d The rescuing effect of lncRNA Gm2199 on the proliferation capacity of AML12 and NCTC1469 cells treated with CCl4, as measured by CCK-8 assay. N = 3 for each group. Note that the transfection of pEGFP-N1-Gm2199 for Gm2199 overexpression abrogated the CCl4-inuced diminishment of proliferation rate of AML12 cells, whereas the negative control construct failed to elicit any significant changes. The experiment data were converted to relative values over the control group and were expressed as mean ± SEM. *P < 0.05, **P < 0.01, and ***P < 0.001 vs. control; #P < 0.05, ##P < 0.01 and ###P < 0.001 vs. CCl4. The rescuing effect of Gm2199 on the proliferation capacity of AML12 (e) and NCTC1469 (f), as measured by Edu staining. The scale bars represent 20 μm
Fig. 6
Fig. 6. The rescuing role of Gm2199 in mouse-damaged livers.
a The exterior and histomorphology appearances of Control, CCl4, CCl4 + AAV-Gm2199, and CCl4 + AAV-NC-treated livers. The scale bars of exterior represent 1 cm, and the scale bars of H&E and Masson represent 10 μm. b Edu staining for proliferating hepatocytes in Control, CCl4, CCl4 + AAV-Gm2199, and CCl4 + AAV-NC-treated livers. The scale bars represent 20 μm. c The relative expression of Gm2199 in Control, CCl4, CCl4 + AAV-Gm2199, and CCl4 + AAV-NC-treated livers, measured by qRT-PCR. The rescuing role of Gm2199 in serum ALT and AST content (d) and hepatic HYP (e) of mice treated with Control, CCl4, CCl4 + AAV-Gm2199, and CCl4 + AAV-NC. The experiment data were expressed as mean ± SEM (n = 4 for each group). *P < 0.05 and ***P < 0.001 vs. control; #P < 0.05, ##P < 0.01, and ###P < 0.001 vs. CCl4
Fig. 7
Fig. 7. The effects of Gm2199 on the activation and the expression of ERK1/2 in damaged hepatocytes.
Representative western blot analysis results for p-ERK1/2 and T-ERK1/2 protein expression from Control, CCl4, CCl4 + pEGFP-N1-Gm2199, and CCl4 + pEGFP-N1 vector-treated AML12 (a) and NCTC1469 (b). QRT-PCR analysis results for ERK1 and ERK2 mRNA expression from Control, CCl4, CCl4 + pEGFP-N1-Gm2199, and CCl4 + pEGFP-N1 vector-treated AML12 (c) and NCTC1469 (d). The experiment data were converted to relative values over the control group and were expressed as mean ± SEM (n = 3 for each group). *P < 0.05, **P < 0.01, and ***P < 0.001 vs. control; #P < 0.05, ##P < 0.01, and ###P < 0.001 vs. CCl4
Fig. 8
Fig. 8. The effects of overexpression of Gm2199 on the the proliferation and viability and the expression of ERK1/2 in normal AML12 and NCTC1469.
PEGFP-N1-Gm2199 was transfected into normal AML12 and NCTC1469 to overexpress Gm2199, and pEGFP-N1 was transfected into normal AML12 and NCTC 1469 as negative control. a Relative cellular proliferation and viability of AML12 and NCTC1469 determined by CCK-8 assay. Representative Western blot and relative brand intensity analysis results for p-ERK1/2 and T-ERK1/2 proteins in AML12 (b) and NCTC1469 (c). The experiment data were converted to relative values over the control group and were expressed as mean ± SEM (n = 3 for each group). *P < 0.05, **P < 0.01, and ***P < 0.001 vs. pEGFP-N1 group

References

    1. Fontana RJ, et al. Idiosyncratic drug-induced liver injury is associated with substantial morbidity and mortality within 6 months from onset. Gastroenterology. 2014;147:96–108.e4. doi: 10.1053/j.gastro.2014.03.045. - DOI - PMC - PubMed
    1. Gopal K, et al. Attrition of hepatic damage inflicted by angiotensin II with alpha-tocopherol and beta-carotene in experimental apolipoprotein E knock-out mice. Sci. Rep. 2015;5:18300. doi: 10.1038/srep18300. - DOI - PMC - PubMed
    1. Ge N, Liang H, Liu Y, Ma AG, Han L. Protective effect of aplysin on hepatic injury in ethanol-treated rats. Food Chem. Toxicol. 2013;62:361–372. doi: 10.1016/j.fct.2013.08.071. - DOI - PubMed
    1. Arguello G, Balboa E, Arrese M, Zanlungo S. Recent insights on the role of cholesterol in non-alcoholic fatty liver disease. Biochim. Biophys. Acta. 2015;1852:1765–1778. doi: 10.1016/j.bbadis.2015.05.015. - DOI - PubMed
    1. Chen RJ, Wu HH, Wang YJ. Strategies to prevent and reverse liver fibrosis in humans and laboratory animals. Arch. Toxicol. 2015;89:1727–1750. doi: 10.1007/s00204-015-1525-6. - DOI - PubMed

Publication types

Substances

LinkOut - more resources