. 2018 May 22;9(1):2010.
doi: 10.1038/s41467-018-04373-8.

Intron retention and nuclear loss of SFPQ are molecular hallmarks of ALS

Affiliations

Intron retention and nuclear loss of SFPQ are molecular hallmarks of ALS

Raphaelle Luisier et al. Nat Commun. .

Abstract

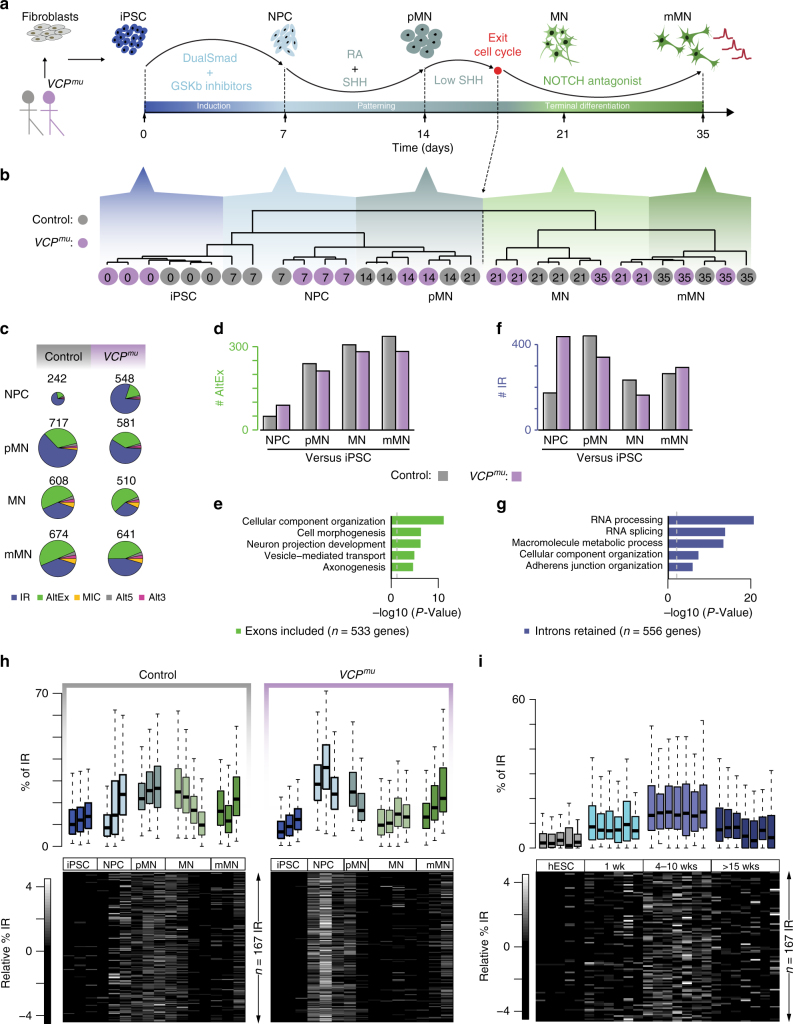
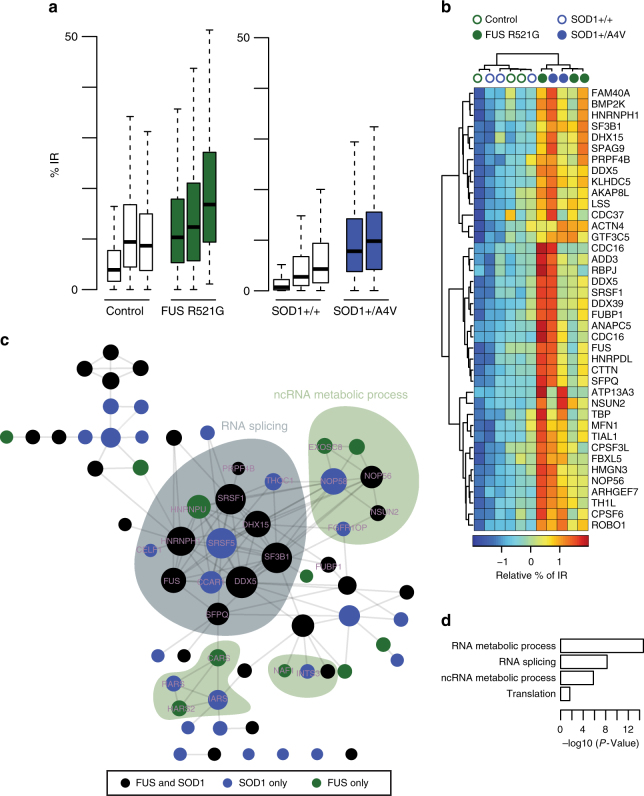
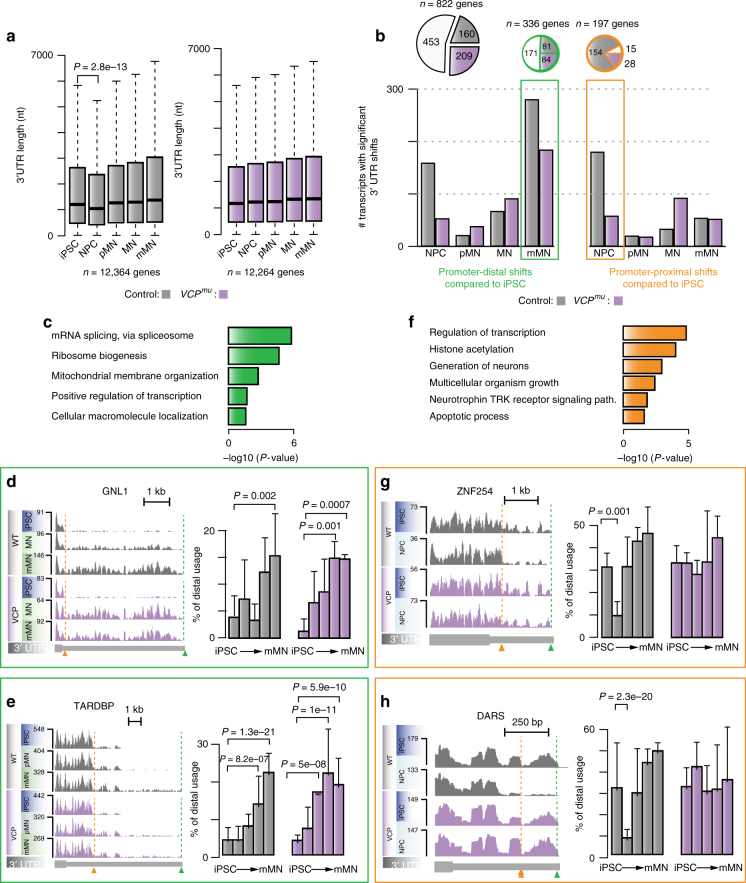
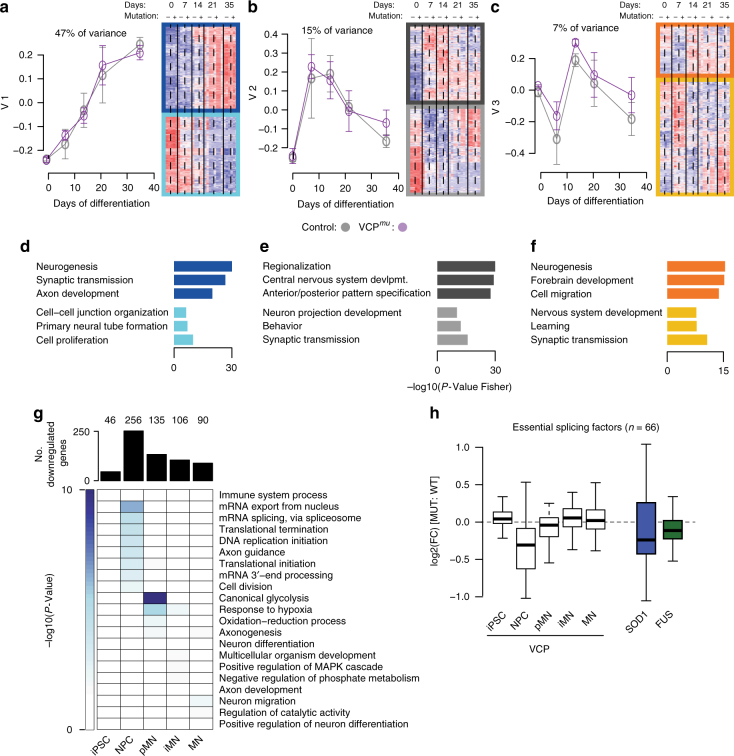
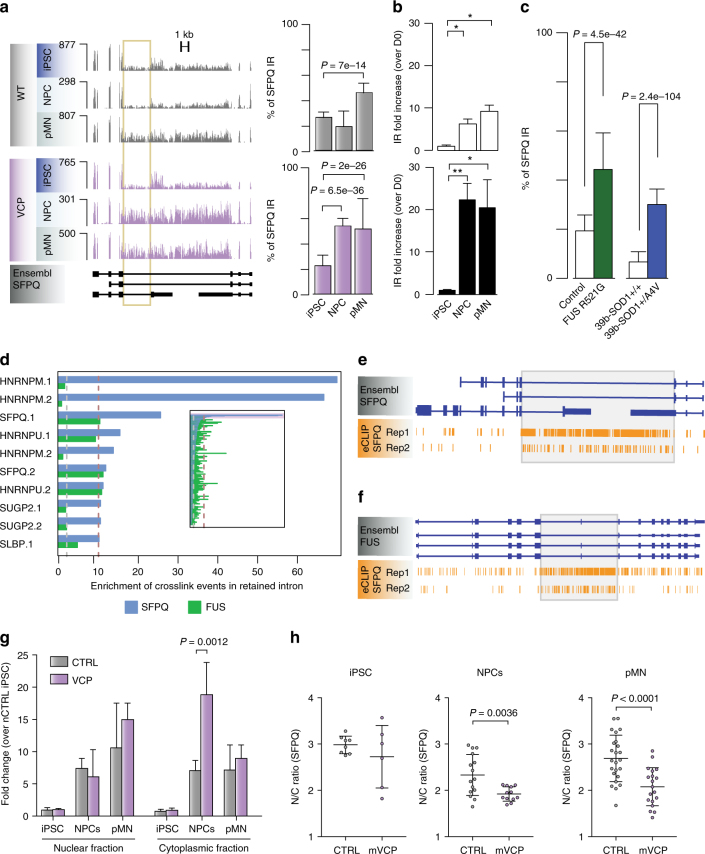
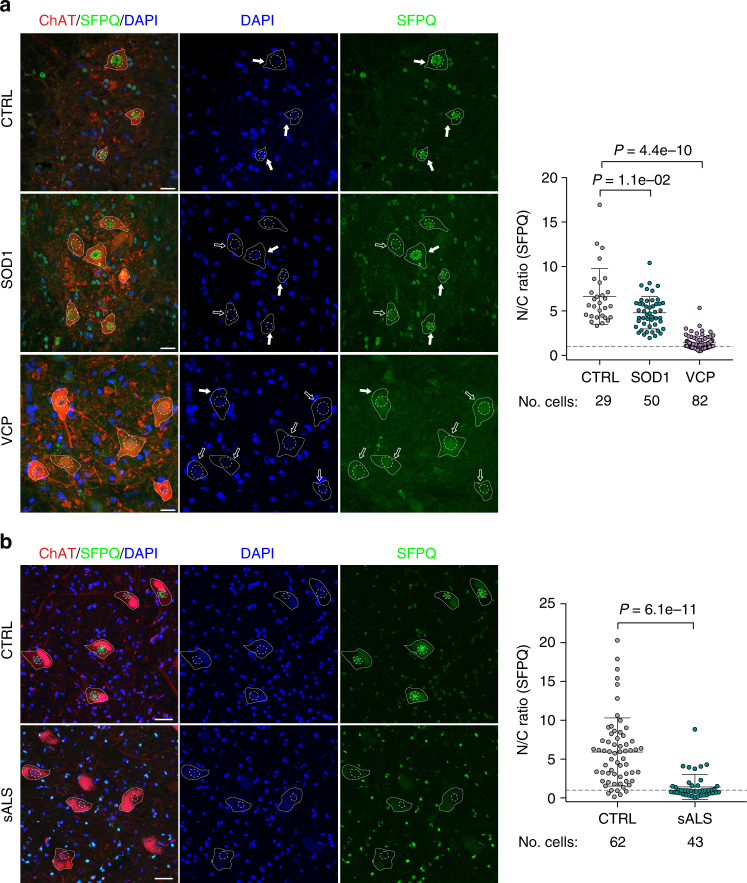
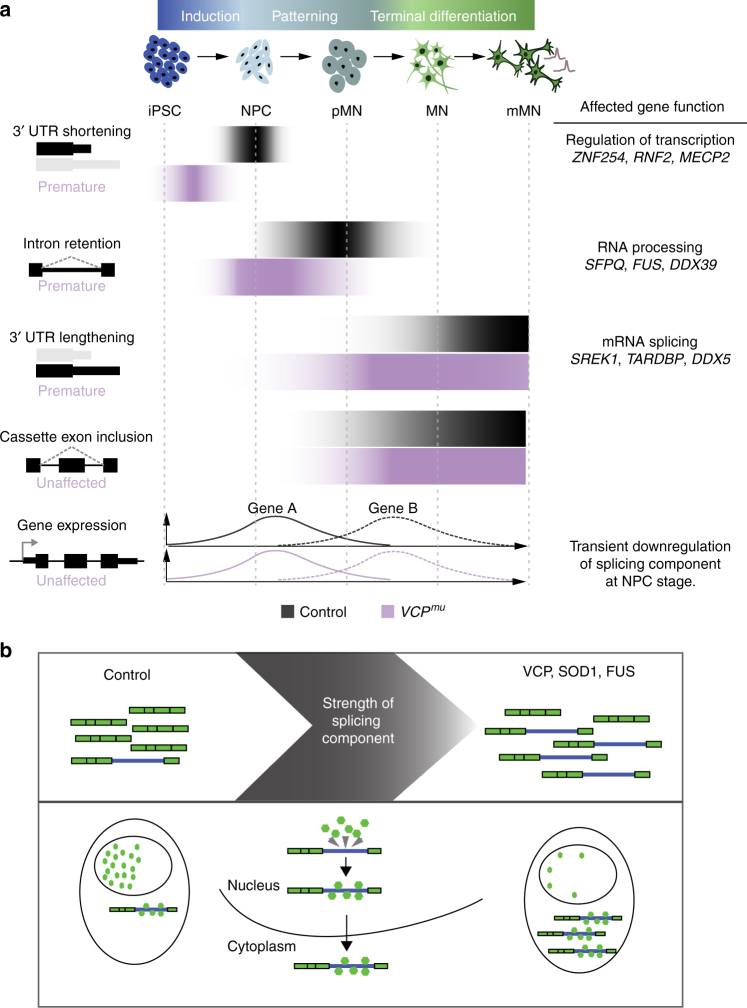
Mutations causing amyotrophic lateral sclerosis (ALS) strongly implicate ubiquitously expressed regulators of RNA processing. To understand the molecular impact of ALS-causing mutations on neuronal development and disease, we analysed transcriptomes during in vitro differentiation of motor neurons (MNs) from human control and patient-specific VCP mutant induced-pluripotent stem cells (iPSCs). We identify increased intron retention (IR) as a dominant feature of the splicing programme during early neural differentiation. Importantly, IR occurs prematurely in VCP mutant cultures compared with control counterparts. These aberrant IR events are also seen in independent RNAseq data sets from SOD1- and FUS-mutant MNs. The most significant IR is seen in the SFPQ transcript. The SFPQ protein binds extensively to its retained intron, exhibits lower nuclear abundance in VCP mutant cultures and is lost from nuclei of MNs in mouse models and human sporadic ALS. Collectively, we demonstrate SFPQ IR and nuclear loss as molecular hallmarks of familial and sporadic ALS.


Conflict of interest statement

The authors declare no competing interests.

Figures

Fig. 1
Fig. 1
Intron retention is the predominant splicing change during early motor neurogenesis and occurs prematurely in VCPmu cultures. a Schematic depicting the iPSC differentiation strategy for motor neurogenesis. Arrows indicate sampling time-points in days. iPSC clones were obtained from two patients with confirmed VCP mutations (R155C and R191Q; total 3 iPSC lines, 1 induction from each line) and 1 clone from each of 2 healthy controls (total 2 different iPSC lines, 2 inductions from one line and 1 induction from the other line). Induced-pluripotent stem cells (iPSC); neural precursors (NPC); “patterned” precursor motor neurons (ventral spinal cord; pMN); post-mitotic but electrophysiologically immature motor neurons (MN); electrophysiologically mature MNs (mMN). b Unsupervised hierarchical clustering of 15,989 genes groups the 31 samples according to neuronal developmental stage, rather than genetic background. Grey circles = control samples; magenta circles = VCPmu samples; sampling time-points are indicated inside the circles. c Pie charts representing proportions of splicing events in control and VCPmu samples at distinct stages of motor neurogenesis compared with the previous time-point. Chart areas are in proportion to total numbers of events at each stage. Intron retention (IR); alternative exon (AltEx); microexons (MIC); alternative 5′ and 3′ UTR (Alt5 and Alt3). d, f Bar graphs representing the numbers of exonic and intronic splicing events, respectively, in control (grey bars) and VCPmu samples (magenta bars) at specific timepoints during MN differentiation. e, g Bar graphs showing the enrichment score of GO biological pathways associated with transcripts undergoing exonic and intronic splicing events in control samples. h Upper, boxplots depicting the distributions of percentage retention (see Methods) for 167 manually curated introns in replicates at distinct stages of differentiation in control (left) and VCPmu samples (right). Boxplots display the five number summary of median, lower and upper quartiles, minimum and maximum values. Lower, heatmaps of the standardised relative percentage of IR in 167 introns in replicate samples at each differentiation stage. i As in h but for in vitro differentiation of hESCs to the neural induction stage (1 week), NPC stage (4–10 weeks) that produces only neurons upon further differentiation and after >15 weeks, a more gliogenic stage which produces both neurons and glial cells
Fig. 2
Fig. 2
Transcripts involved in neural induction exhibit widespread intron retention in MNs derived from FUS and SOD1 ALS-causing mutations. a Boxplots displaying the distribution of percentage retention for 167 manually curated introns in control MNs (white box), FUSmu mutant MNs (grey box) or SOD1mu MNs samples (blue bar),. Mutant samples exhibit systematically a higher proportion of IR compared with controls. Boxplots are as shown in Fig. 1h. b Hierarchically clustered (Manhattan distance and Ward clustering) heatmap of relative IR levels in 40 genes showing statistically significant retention during motor neurogenesis in both SOD1mu and FUSmu MNs. Blue circles = SOD1mu samples, grey circles = FUSmu samples and empty circles = control samples. c Network of protein–protein interactions for genes exhibiting IR during motor neurogenesis in either SOD1mu or FUSmu MNs. Edges represent experimentally determined protein–protein interactions annotated in the STRING database. Nodes indicate proteins, coloured according to the conditions in which the corresponding transcript displays IR; circle sizes are in proportion to the number of edges in the network. d Bar graphs showing the enrichment scores (P-value from Fisher count test) of GO biological pathways associated with genes that exhibit IR during motor neurogenesis in SOD1mu and/or FUSmu MNs compared with controls
Fig. 3
Fig. 3
3′ UTR length variation during human motor neurogenesis. a Boxplots of the distributions of maximum 3′ UTR lengths expressed at distinct stages of MN differentiation in control (left) and VCPmu samples (right). P-value obtained with Wilcoxon test. b Bar plots displaying the numbers of 3′ UTR with statistically significant promoter-distal (left) and promoter-proximal (right) shifts at distinct stage of differentiation compared with iPSCs in control (grey bars) and VCPmu samples (magenta bars). Inset, pie charts representing the proportions of genes exhibiting alternative 3′ UTR usage in control and VCPmu samples (white), control samples only (grey area) or VCPmu samples only (magenta area). c GO enrichment analysis of biological pathways associated with genes showing statistically significant distal shifts in poly(A) site usage in control mMNs compared to control iPSCs. d, e Left, genome browser views of RNA-seq profiles in the 3′ UTRs of genes GNL1 and TARDBP which exhibit statistically significant proximal-to-distal shifts in poly(A) site usage in mMNs compared with iPSCs. Right, bar plots showing distal 3′ UTR usage relative to the proximal 3′ UTR. P-values obtained with Fisher count test. f Same as c for genes showing statistically significant proximal shifts in poly(A) site usage in control NPCs compared with control iPSCs. g, h Same as d for genes ZNF254 and DARS exhibiting statistically significant distal-to-proximal shifts in poly(A) site usage in NPCs compared with iPSCs
Fig. 4
Fig. 4
Global downregulation of splicing components coincides with IR. ac Singular value decomposition analysis of the expression of 15,989 genes in n = 31 samples. Left, Line plots showing the expression profiles of the first three singular vectors v1 through v3, capturing 47%, 15% and 7% of the variance in gene expression, respectively. Grey and magenta data points indicate expression for the control and VCPmu samples. Right, heatmap of the standardised expression of genes whose expression profiles correlate positively (indicated by top three darker rectangles) and negatively (indicated by bottom three lighter rectangles) with the first three right singular vectors. df Bar plots displaying the enrichment scores for GO biological functions of genes that correlate positively (top three bars) or negatively (bottom three bars) with the first three right singular vectors. g Upper, bar plots depicting the numbers of downregulated genes in VCPmu samples compared with control at distinct stages of MN differentiation. Lower, heatmap of the GO biological functions enriched among downregulated genes at the corresponding time-points. h Boxplots showing the distributions of log2 fold-changes for 66 essential splicing factor genes between ALS mutants and controls; white boxes = VCPmu compared with controls, blue box = SOD1mu compared with isogenic controls, green box = FUSmu compared with controls
Fig. 5
Fig. 5
Aberrant SFPQ intron retention in diverse genetic forms of ALS and its interplay with the SFPQ protein. a Left, genome browser views of RNA-seq profiles for the intron-retaining gene SFPQ in control and VCPmu samples at iPSC, NPC and pMN stages. 9 kb intron 9/9 of interest is indicated with yellow box. Right, bar graphs quantifying percentage IR across the entire time course in control and VCPmu samples (mean ± s.d.; Fisher count test). b Bar plots displaying SFPQ IR levels measured by qPCR; white bars = controls, black bars = VCPmu. IR levels at each timepoint were compared with that of the iPSC stage of the same group. N = 3 control lines and N = 4 VCP lines (mean + s.d. *p < 0.05, **p < 0.01, one-way ANOVA with Dunnet correction for multiple comparisons). c Bar plots showing the percentage SFPQ IR for FUSmu or SOD1mu MNs in control compared with (mean ± s.d.; Fisher count test). d Bar plots depicting the level of enrichment in RBP-binding to the retained intron compared with the non-retained introns within the same gene; blue bars = SFPQ gene, green bars = FUS gene. ef Genome browser view of SFPQ eCLIP crosslinking events along SFPQ and FUS transcript annotations. Grey boxes highlight the location of retained introns. g Bar plots showing the level of nuclear and cytoplasmic localisation of IR transcripts measured by qPCR. IR levels in each fraction were compared with that of the nuclear fraction of control iPSCs. N = 3 control lines and N = 4 VCP lines, mean + s.d. P-value from two-way ANOVA with Tukey correction for multiple comparisons. h Subcellular localisation of SPFQ determined by immunocytochemistry in iPSCs, NPCs and pMNs. The ratio of the average intensity of the SFPQ staining in the nucleus (N) vs cytoplasm (C) was automatically determined in both CTRL and VCPmu cells. Data shown is average N/C ratio (±s.d.) per field of view from four control and four VCPmu lines. P-value from unpaired t-test with Welch’s correction. See also Supplementary Fig. 7d
Fig. 6
Fig. 6
SFPQ nuclear clearance is a molecular hallmark of genetic and sporadic ALS. a Analysis of the subcellular localisation of SFPQ in MNs in the ventral spinal cord of wild-type, VCPA232E and SOD1G93A mice. MN cytoplasm was identified by ChAT staining, nuclei were counterstained with DAPI. Data shown is nuclear/cytoplasmic (N/C) ratio (mean ± s.d.) per cell from three wild-type, 4 SOD1G93A and 3 VCPA232E mice. Scale bar: 20 μm. P-values from one-sided Welch’s t-test. Cells from individual animals in each condition were pooled together after excluding individual mice effect by comparing full linear (disease and individual factor) with reduced linear (disease only) models using the Akaike Information Criterion. b Analysis of the subcellular localisation of SFPQ in MNs in the ventral spinal cord of healthy controls and patients with sporadic ALS (sALS). MN cytoplasm was identified by ChAT staining, nuclei were counterstained with DAPI. Only MNs with a visible nucleus were considered for the analysis. Scale bar 50 μm. Data shown is N/C ratio (mean ± s.d.) per cell from three cases per group
Fig. 7
Fig. 7
Schematic diagram of proposed model. a Cartoon summarising the time course of post-transcriptional events underlying human motor neurogenesis in control and VCPmu samples. Our results suggest that the predominant RNA-processing events at an early stage of neural differentiation are IR and 3′ UTR remodelling. These events start prematurely in VCPmu samples but do not affect major transcriptional programmes underlying human MN differentiation. b Cartoon summarising the functional consequence of aberrant IR in SFPQ gene across diverse genetic and sporadic forms of ALS. The 9 kb intron 9/9 in SFPQ is retained across all ALS-mutant backgrounds, which leads to increased cytoplasmic abundance of affected transcripts. The SFPQ protein binds extensively to the retained intron. The SFPQ protein itself is relocalised from the nucleus to the cytoplasm in all ALS-mutant backgrounds, as well as post-mortem samples of sporadic ALS patients

References

    1. Zhang X, et al. Cell-type-specific alternative splicing governs cell fate in the developing cerebral cortex. Cell. 2016;166:1147–1162.e15. doi: 10.1016/j.cell.2016.07.025. - DOI - PMC - PubMed
    1. Yap K, Xiao Y, Friedman BA, Je HS, Makeyev EV. Polarizing the neuron through sustained co-expression of alternatively spliced isoforms. Cell Rep. 2016;15:1316–1328. doi: 10.1016/j.celrep.2016.04.012. - DOI - PMC - PubMed
    1. Tian B, Manley JL. Alternative polyadenylation of mRNA precursors. Nat. Rev. Mol. Cell. Biol. 2017;18:18–30. doi: 10.1038/nrm.2016.116. - DOI - PMC - PubMed
    1. Nilsen TW, Graveley BR. Expansion of the eukaryotic proteome by alternative splicing. Nature. 2010;463:457–463. doi: 10.1038/nature08909. - DOI - PMC - PubMed
    1. Buckley PT, et al. Cytoplasmic intron sequence-retaining transcripts can be dendritically targeted via ID element retrotransposons. Neuron. 2011;69:877–884. doi: 10.1016/j.neuron.2011.02.028. - DOI - PMC - PubMed

Publication types

MeSH terms