. 2018 May 22;9(1):1944.
doi: 10.1038/s41467-018-04070-6.

Autophagy promotes the survival of dormant breast cancer cells and metastatic tumour recurrence

Affiliations

Autophagy promotes the survival of dormant breast cancer cells and metastatic tumour recurrence

Laura Vera-Ramirez et al. Nat Commun. .

Abstract

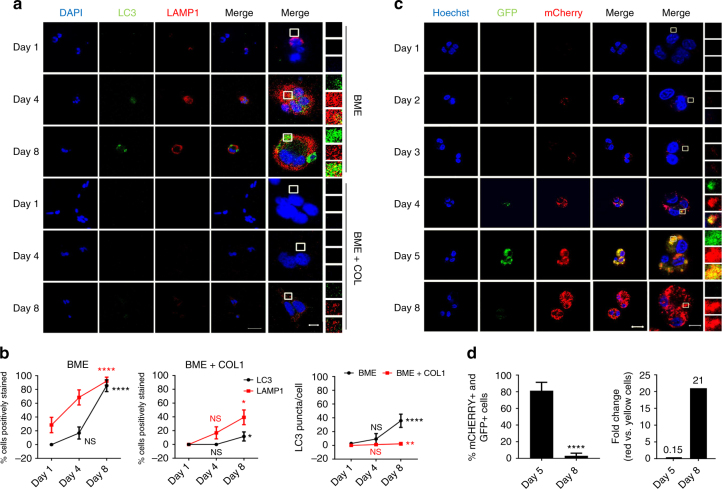
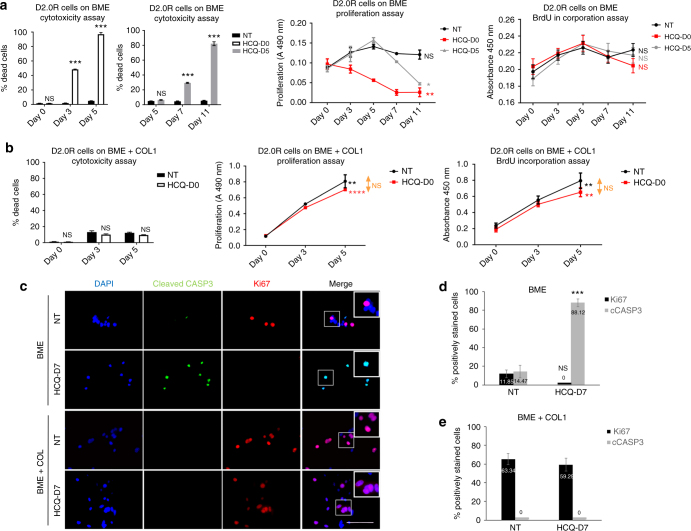
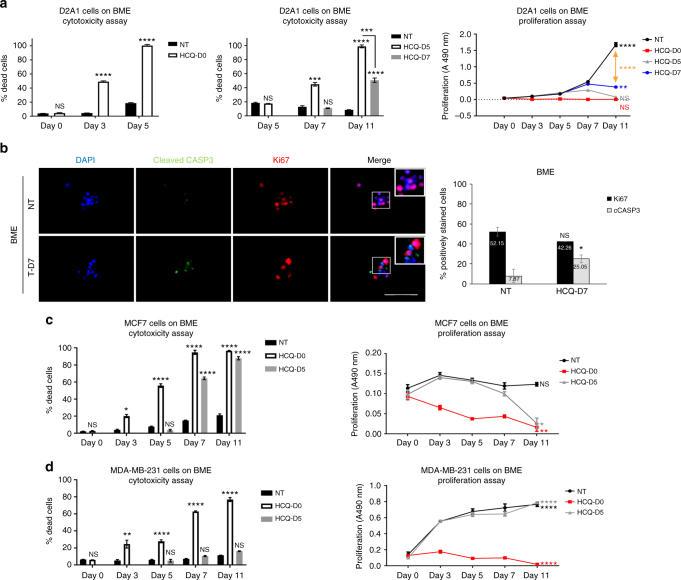
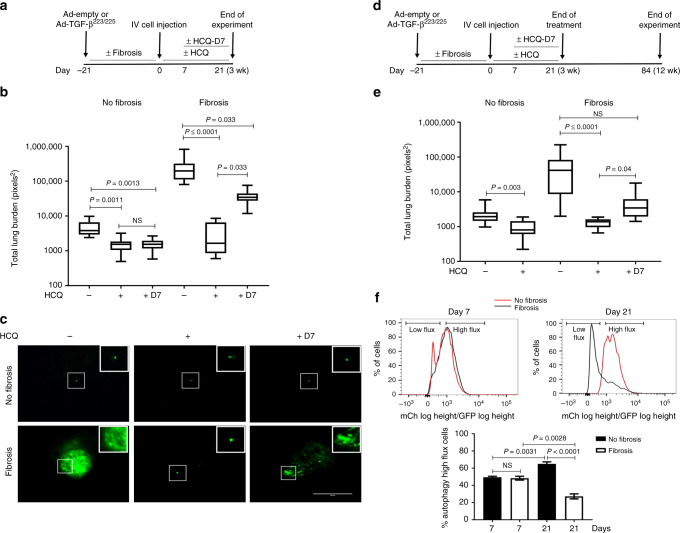
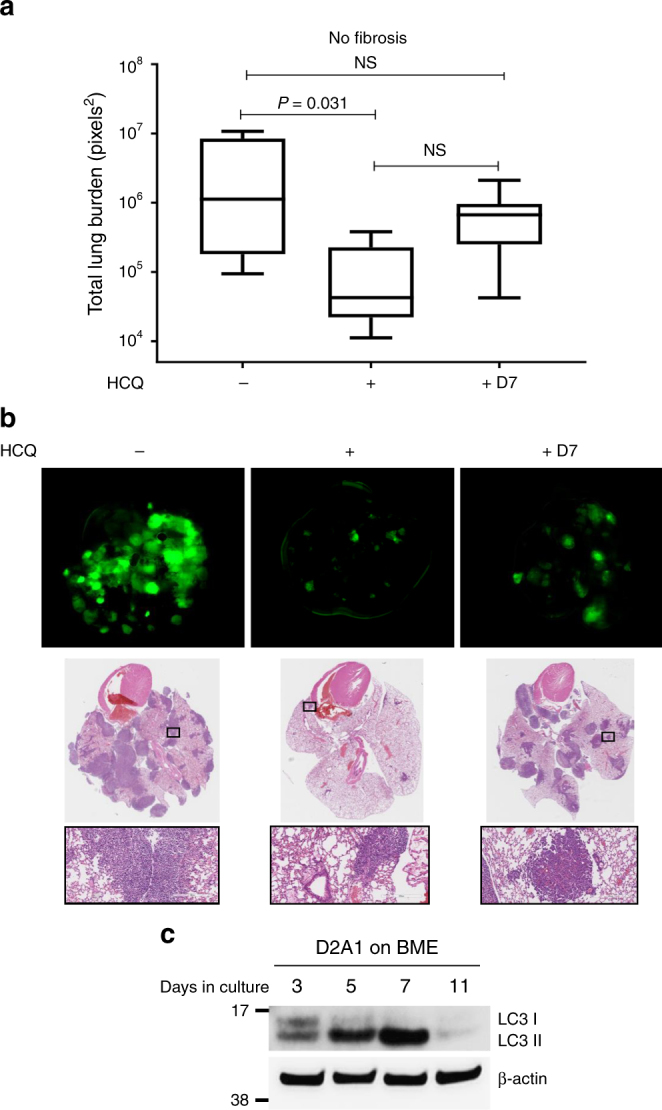
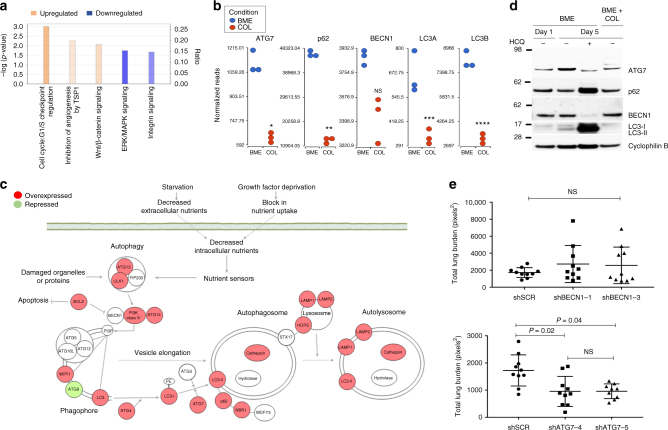
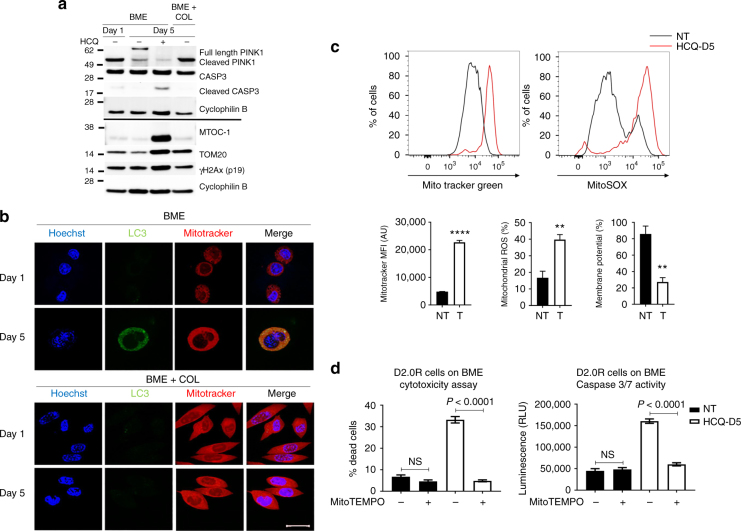
Cancer recurrence after initial diagnosis and treatment is a major cause of breast cancer (BC) mortality, which results from the metastatic outbreak of dormant tumour cells. Alterations in the tumour microenvironment can trigger signalling pathways in dormant cells leading to their proliferation. However, processes involved in the initial and the long-term survival of disseminated dormant BC cells remain largely unknown. Here we show that autophagy is a critical mechanism for the survival of disseminated dormant BC cells. Pharmacologic or genetic inhibition of autophagy in dormant BC cells results in significantly decreased cell survival and metastatic burden in mouse and human 3D in vitro and in vivo preclinical models of dormancy. In vivo experiments identify autophagy gene autophagy-related 7 (ATG7) to be essential for autophagy activation. Mechanistically, inhibition of the autophagic flux in dormant BC cells leads to the accumulation of damaged mitochondria and reactive oxygen species (ROS), resulting in cell apoptosis.


Conflict of interest statement

The authors declare no competing interests.

Figures

Fig. 1
Fig. 1
D2.0 R cells activate autophagy upon entering a dormant state. Representative images are shown for a Immunofluorescent staining of lysosomal (LAMP1, red) and autophagic (LC3, green) markers of D2.0 R cells in BME (upper panels) and BME + COL1 (lower panels) with b Quantification of the percentage of cells exhibiting LC3 positive puncta and LAMP1 staining out of the total number of cells analysed (mean ± s.e.m, n = 30–42 cells. Comparisons are relative to Day 1 by Kruskal–Wallis, Dunn’s post test. *P ≤ 0.05; ****P ≤ 0.0001) and the average number of LC3 puncta per cell (Comparisons by Kruskal–Wallis, Dunn’s post test. **P ≤ 0.01 and ****P ≤ 0.0001). c D2.0 R cells transfected with the mCherry-GFP-LC3 reporter show activation and completion of the autophagic cycle (red fluorescence only) when plated in BME matrices for 8 days. d The graphs represent the percentage of cells with double-positive puncta (mCherry+ and GFP+) (autophagosomes) out of the total number of cells analysed (left graph) (mean ± s.e.m, n = 35–39 cells). Comparisons by Kruskal–Wallis, Dunn’s post test. ****P ≤ 0.0001) and the rate of conversion from cells exhibiting yellow puncta to red-only puncta expressed as fold change (right graph). Scale bars are 50 and 10 μm for a and 20 and 10 μm for b
Fig. 2
Fig. 2
Inhibiting autophagy reduces the viability of D2.0 R dormant cells. Figure shows data of one out of three independent experiments done in triplicate with equivalent results for each assay. a 50 µM Hydroxycholoroquine (HCQ) induced a significant reduction in the proportion of viable D2.0 R cells on BME, as determined by cytotoxicity assay (mean ± s.e.m, n = 3 wells. Comparisons by unpaired two-sided T-test. ***P ≤ 0.0001), proliferation assay (mean ± s.e.m, n = 3 wells. Comparisons at day 11 by unpaired two-sided T-test. *P ≤ 0.05 and **P ≤ 0.01 relative to Day 0 for each group) and BrdU incorporation assay (mean ± s.e.m, n = 3 wells. Comparisons at Day 5 by unpaired two-sided T-test relative to Day 0 for each group) regardless of whether the treatment was or was not delayed after seeding the cells. b HCQ did not affect the numbers of viable D2.0 R cells on BME + COL, as determined by a cytotoxicity assay (mean ± s.e.m, n = 3 wells. Comparisons by unpaired two-sided T-test), proliferation assay (mean ± s.e.m, n = 3 wells. Comparison Day 11 vs. Day 0 by unpaired two-sided T-test. **P ≤ 0.01 and ****P ≤ 0.0001) and BrdU incorporation assay (mean ± s.e.m, n = 3 wells. Comparisons at Day 5 by unpaired two-sided T-test. **P ≤ 0.01 relative to Day 0 for each group). c Representative Ki67 (red) and cleaved caspase 3 (green) immunofluorescence of D2.0 R cells on BME (upper panels) and D2.0 R cells on BME + COL (lower panels), either treated with 50 µM HCQ or vehicle. Scale bar is 100μm. Proliferative and apoptotic indexes of D2.0 R on BME or BME plus COL1 were calculated as the percentage of cells expressing Ki67 or cleaved Casp 3, as shown in d for cells on BME (mean ± s.e.m, n = 159–173 cells. Comparison by Mann–Whitney U-test, two-sided. ***P ≤ 0.0001) and e for cells on BME + COL1 (mean ± s.e.m, n = 167–257 cells. Comparison by Mann–Whitney U-test, two-sided), respectively. HCQ-D0 cells treated with HCQ immediately after plating on Day 0, HCQ-D5 cells treated with HCQ after 5 days in culture, HCQ-D7 cells treated with HCQ after 7 days in culture, NT non-treated
Fig. 3
Fig. 3
Inhibiting autophagy reduces proliferative switch in 3D culture. Figure shows data of one out of three independent experiments done in triplicate with equivalent results. a 50 µM Hydroxycholoroquine (HCQ) significantly reduced the proportion of viable D2A1 cells on BME during quiescence (treatment at day 0 (D0), left panel), which is attenuated when treated after the dormant-to-proliferative switch (day 5 (D5) or day 7 (D7), middle panel) as determined by cytotoxicity assay (mean ± s.e.m, n = 3 wells. Comparisons at day 5 (left panel) or day 11 (middle panel) by unpaired two-sided T-test. ***P ≤ 0.001 ****P ≤ 0.0001) and proliferation assays (right panel. Mean ± s.e.m, n = 3 wells. Comparisons at Day 11 by unpaired two-sided T-test. **P ≤ 0.01 and ****P ≤ 0.0001 relative to day 0 for each group). b Representative Ki67 (red) and cleaved caspase 3 (green) immunofluorescence of D2A1 cells on BME treated with 50 µM HCQ or vehicle (left panel), with quantification of markers at day 11 (right panel, mean ± s.e.m, n = 170–194 cells. (Mann–Whitney U-test, two-sided. *P ≤ 0.05). Scale bar is 100 μm. c HCQ significantly reduced viable MCF7 cells on BME (left panel, mean ± s.e.m, n = 3 wells. Comparisons by two-sided unpaired T-test (Day 0 and Day 3) or one-way ANOVA plus Bonferroni post test for day 5, day 7 and day 11 time points. **P ≤ 0.01; ****P ≤ 0.0001) and proliferation assays (right panel, mean ± s.e.m, n = 3 wells. Comparisons at day 11 by unpaired two-sided T-test. *P ≤ 0.05; **P ≤ 0.01 relative to day 0 for each group). d HCQ did not significantly reduce the number of MDA-MB-231 viable cells on BME when treated after the dormant-to-proliferative switch (left panel, mean ± s.e.m, n = 3 wells. Comparisons by unpaired two-sided T-test (day 0 and day 3) or one-way ANOVA plus Bonferroni post test for day 5, day 7 and day 11 time points. **P ≤ 0.01; ****P ≤ 0.0001) and proliferation assay (right panel, mean ± s.e.m, n = 3 wells. Comparisons at day 11 by unpaired T-test, two-sided. ***P ≤ 0.001; ****P ≤ 0.0001 relative to Day 0 for each group). HCQ-D0 cells treated with HCQ immediately after plating, HCQ-D5 cells treated with HCQ after 5 days in culture, HCQ-D7 cells treated with HCQ after 7 days in culture, NT non-treated
Fig. 4
Fig. 4
Delayed autophagy inhibition increases viable cells in fibrotic lungs. a Experimental design. b Total lung surface burden of CD1nu/nu mice receiving Ad-empty (No fibrosis) or Ad-TGF-β223/225 (Fibrosis) and tail vein injections of 1 × 106 D2.0 R GFP cells, followed by vehicle (−), 50 mg/kg body weight of HCQ 5 days a week for 3 weeks (+) or vehicle daily for 7 days followed by 50 mg/kg body weight of HCQ 5 days a week for additional 2 weeks (+D7) (mean ± s.e.m, n = 9–10 mice per group. Comparisons by Kruskal–Wallis, Dunn’s post test). c Representative images of single dormant cells and multicellular metastatic lesions expressing GFP in the lung from the experiment in b, scale bar is 400 μm. d Similar experiment to that in a, except that the time animals were followed after the cessation of treatment with HCQ to the final study endpoint that was extended for additional 9 weeks. e Total lung surface D2.0 R GFP cell burden from experiment d of CD1nu/nu mice receiving Ad-empty (No fibrosis) or Ad-TGF-β223/225 (Fibrosis) and tail vein injections of 1 × 106 D2.0 R GFP cells, followed by vehicle (−), 50 mg/kg body weight of HCQ 5 days a week for 3 weeks (+) or vehicle daily for 7 days followed by 50 mg/kg body weight of HCQ 5 days a week for additional 2 weeks (fibrosis group only) (+D7) (mean ± s.e.m, n = 9–10 mice per group. Comparisons by Kruskal–Wallis, Dunn’s post test). f High autophagy flux D2.0 R cells present in the lung of CD1nu/nu mice receiving Ad-empty (No fibrosis) or Ad-TGF-β223/225 (Fibrosis) and tail vein injections of 1 × 106 D2.0 R mCherry-GFP-LC3 cells after 7 or 21 days (mean ± s.e.m, n = 15 mice per group. Comparisons by Kruskal–Wallis, Dunn’s post test)
Fig. 5
Fig. 5
Inhibition of autophagy reduces metastatic outbreak of dormant cells. a Total lung surface burden of CD1nu/nu mice receiving Ad-empty (No fibrosis) or Ad-TGF-β223/225 (Fibrosis) and tail vein injections of 1 × 106 D2A1-GFP cells. Mice received either vehicle (−), 50 mg/kg body weight of Hydroxychloroquine (HCQ) 5 days a week for 3 weeks (+) or vehicle daily for 7 days followed by 50 mg/kg body weight of HCQ 5 days a week for additional 2 weeks (+D7) (mean ± s.e.m, n = 8–9 mice per group. Comparisons by Kruskal–Wallis, Dunn’s post test). b Representative images of metastatic lesions in the lung from a, upper panels, D2A1 cells expressing GFP; middle panels, H&E staining of cross sections of lungs; bottom panels, higher magnification of H&E stained metastatic lesions. c Representative western blot of LC3-I and LC3-II from D2A1 cells plated on BME on days 3, 5, 7 and 11
Fig. 6
Fig. 6
Dormant cells activate a BECN1-independent autophagy pathway. a Up and downregulation of breast cancer dormancy-related signalling pathways in D2.0 R cells on BME after 5 days in culture as compared with D2.0 R cells on BME after 1 day in culture. b Dot plots representing the differential expression of selected autophagy genes in D2.0 R cells on BME matrices as compared to D2.0 R cells on BME plus COL1 matrices at day 5 of culture (n = 3 independent samples per condition. Comparisons by Partek Gene Specific Analysis (GSA) algorithm, false discovery rate (FDR) set at 0.05. *P = 5.45 × 10−5; **P = 4.25 × 10−6; ***P = 3.05 × 10−4; ****P = 9.31 × 10−6). c Graphical summary of the expression profile of canonical autophagy genes in D2.0 R cells on BME after 5 days in culture as compared with D2.0 R cells on BME plus COL1 after 5 days in culture. d Representative western blot of autophagy markers from D2.0 R cells plated on BME or BME plus COL1 with or without HCQ on days 1 and 5. e Total lung surface metastatic burden in CD1nu/nu mice injected with D2.0R-GFP stably expressing shSCR (scrambled), shBECN1 (shRNA 1 and 3) (upper panel) or shATG7 (shRNA 4 and 5) (lower panel)
Fig. 7
Fig. 7
Autophagy inhibition leads to dysfunctional mitochondria and apoptosis. a Representative western blot of mitophagy markers from D2.0 R cells plated on BME or BME plus COL1 with or without HCQ on days 1 and 5. b Representative images of live D2.0 R cells transfected with the GFP-LC3 reporter and stained with MitoTracker® Red CMXRos on BME or BME plus COL1 matrices for 5 days. Scale bar is 20 µm c Mitochondrial (MitoTracker® Green), mitochondrial reactive oxygen species (ROS; MitoSox™) and mitochondrial membrane potential (TMRM) quantification in D2.0 R cells on BME or BME plus COL1 matrices with or without HCQ (mean ± s.e.m, n = 60,000 cells from 3 independent experiments. Comparisons by Mann–Whitney U-test, two-sided. **P ≤ 0.01; ****P ≤ 0.0001). NT, non-treated; HCQ-D5, hydroxychloroquine treatment beginning on day 5; MFI, mean fluorescence intensity. d MitoTempo is protective of ROS-induced cell death in D2.0 R cells on BME treated with HCQ. Cells were pre-treated for 5 days with 20 μM MitoTempo and subsequently exposed to 50 μM HCQ for 24 hrs. Cell viability was assessed by Cytotox Glo assay (left graph. Mean ± s.e.m, n = 3 wells. Comparisons by unpaired two-sided T-test) and Caspase 3 and 7 activity (right graph. Mean ± s.e.m, n = 3 wells. Comparisons by unpaired two-sided T-test). Data are representative of three independent experiments

References

    1. Maishman T, et al. Local recurrence and breast oncological surgery in young women with breast cancer: The POSH Observational Cohort Study. Ann. Surg. 2017;266:165–172. doi: 10.1097/SLA.0000000000001930. - DOI - PMC - PubMed
    1. Lambert AW, Pattabiraman DR, Weinberg RA. Emerging biological principles of metastasis. Cell. 2017;168:670–691. doi: 10.1016/j.cell.2016.11.037. - DOI - PMC - PubMed
    1. Sosa MS, Bragado P, Aguirre-Ghiso JA. Mechanisms of disseminated cancer cell dormancy: an awakening field. Nat. Rev. Cancer. 2014;14:611–622. doi: 10.1038/nrc3793. - DOI - PMC - PubMed
    1. Aguirre-Ghiso JA. Models, mechanisms and clinical evidence for cancer dormancy. Nat. Rev. Cancer. 2007;7:834–846. doi: 10.1038/nrc2256. - DOI - PMC - PubMed
    1. Barkan D, Green JE, Chambers AF. Extracellular matrix: a gatekeeper in the transition from dormancy to metastatic growth. Eur. J. Cancer. 2010;46:1181–1188. doi: 10.1016/j.ejca.2010.02.027. - DOI - PMC - PubMed

Publication types

MeSH terms