. 2018 May 22;9(1):2013.
doi: 10.1038/s41467-018-04419-x.

Plasma membrane LAT activation precedes vesicular recruitment defining two phases of early T-cell activation

Affiliations

Plasma membrane LAT activation precedes vesicular recruitment defining two phases of early T-cell activation

Lakshmi Balagopalan et al. Nat Commun. .

Abstract

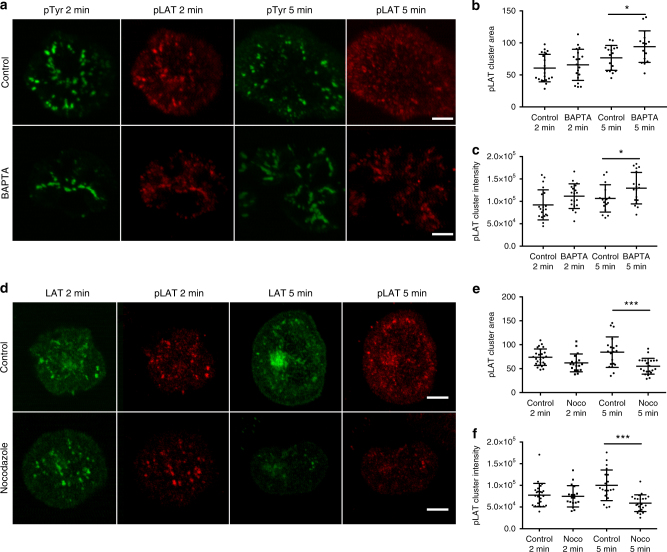
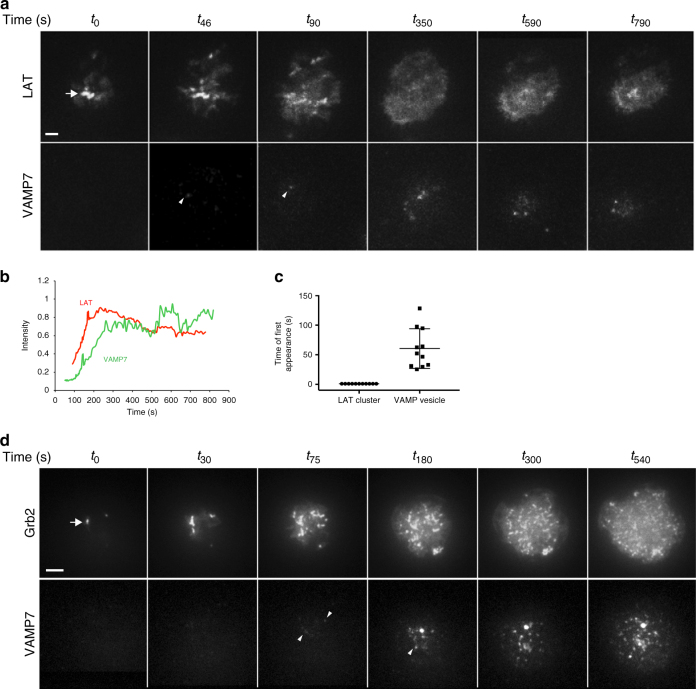
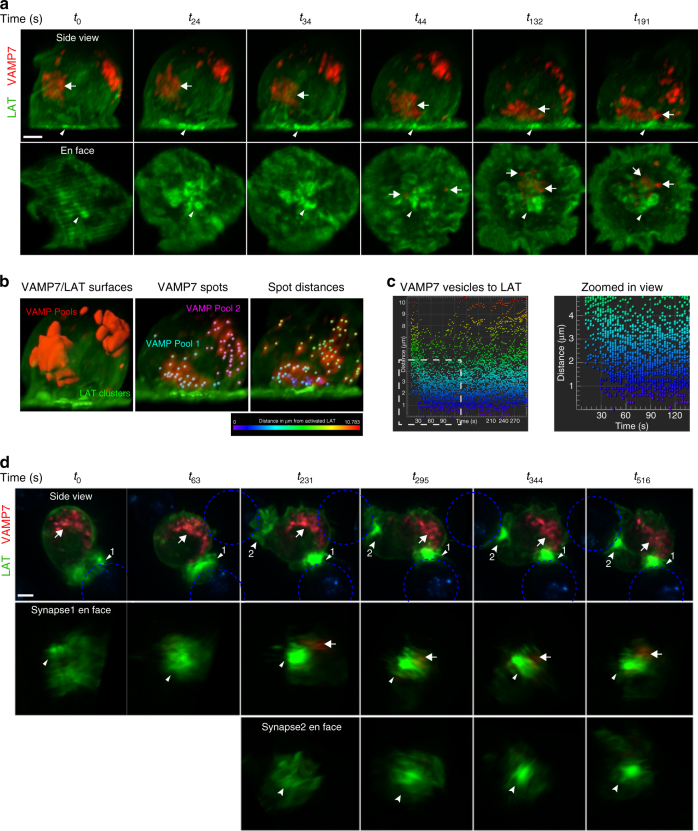
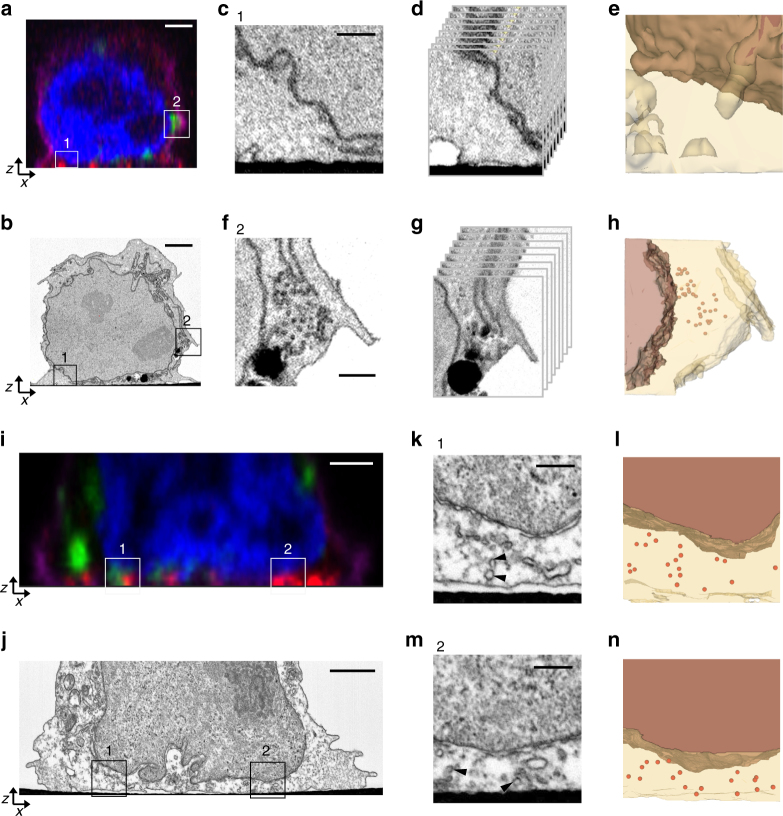
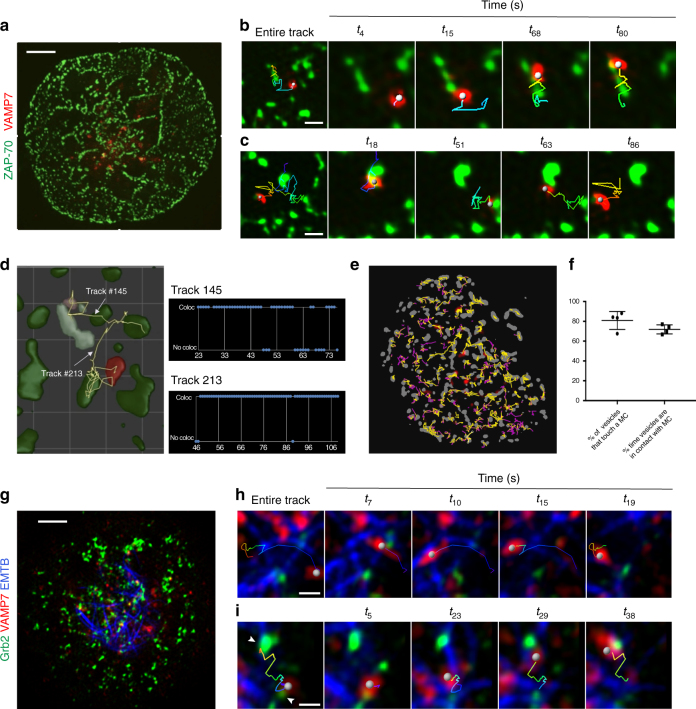
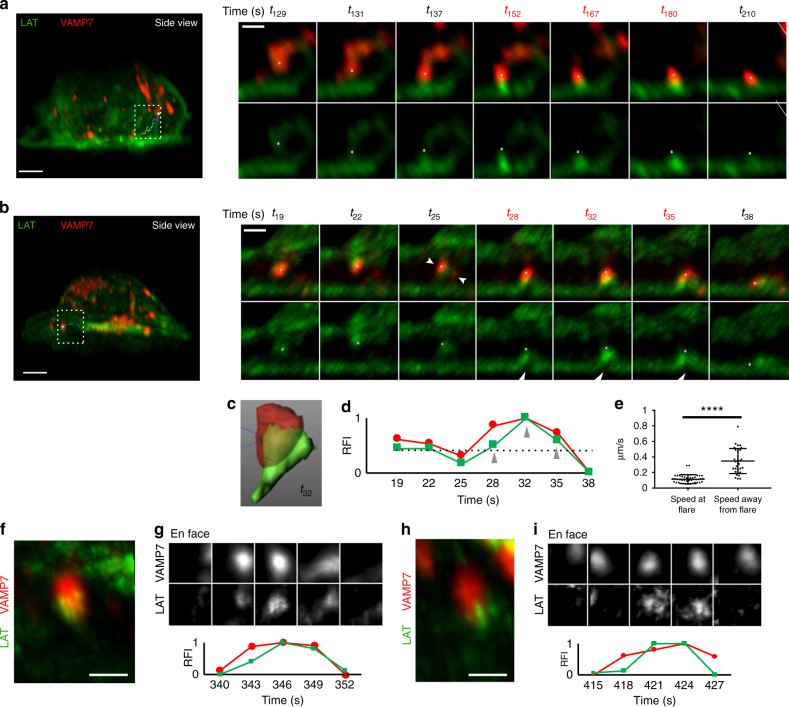
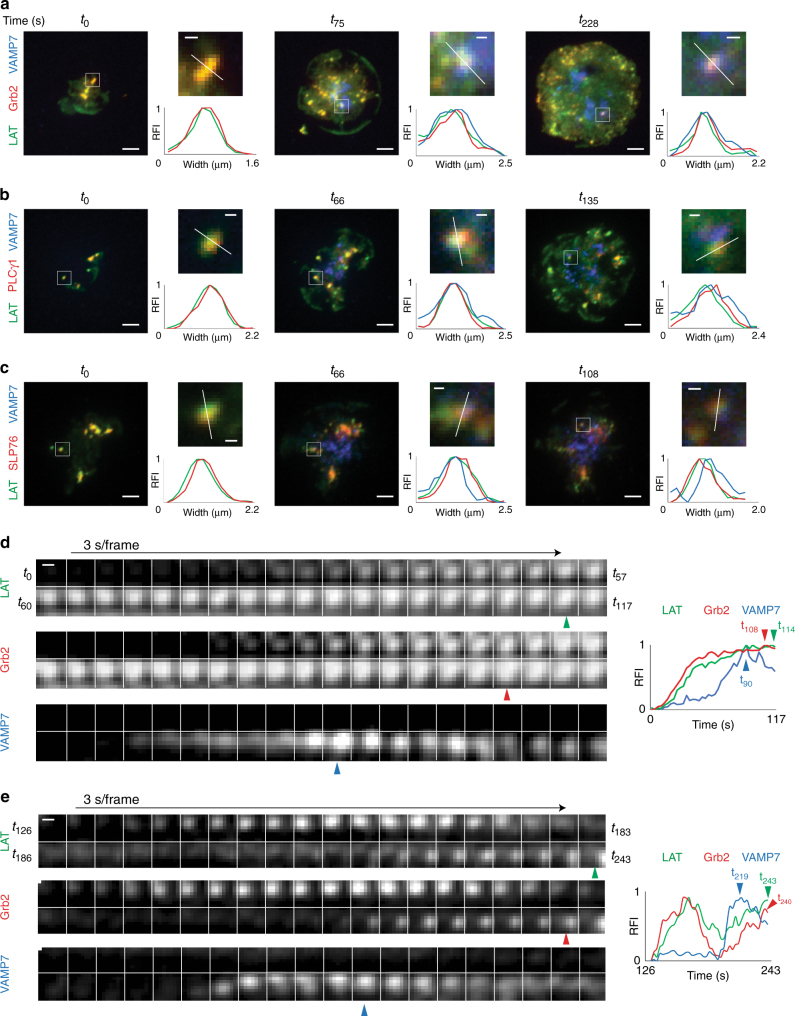
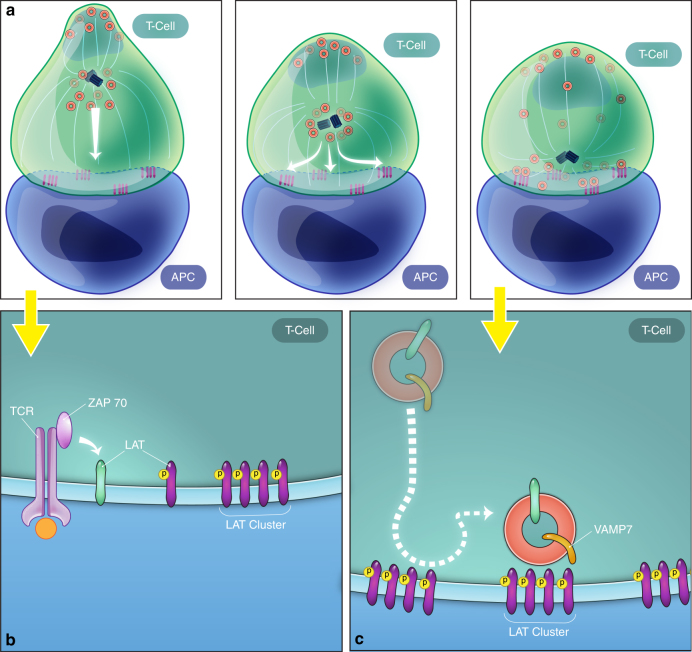
The relative importance of plasma membrane-localized LAT versus vesicular LAT for microcluster formation and T-cell receptor (TCR) activation is unclear. Here, we show the sequence of events in LAT microcluster formation and vesicle delivery, using lattice light sheet microscopy to image a T cell from the earliest point of activation. A kinetic lag occurs between LAT microcluster formation and vesicular pool recruitment to the synapse. Correlative 3D light and electron microscopy show an absence of vesicles at microclusters at early times, but an abundance of vesicles as activation proceeds. Using TIRF-SIM to look at the activated T-cell surface with high resolution, we capture directed vesicle movement between microclusters on microtubules. We propose a model in which cell surface LAT is recruited rapidly and phosphorylated at sites of T-cell activation, while the vesicular pool is subsequently recruited and dynamically interacts with microclusters.


Conflict of interest statement

The authors declare no competing interests.

Figures

Fig. 1
Fig. 1
BAPTA and nocodazole inhibition do not affect LAT microcluster formation. a Jurkat cells were treated with DMSO and dropped onto stimulatory coverslips in a medium containing DMSO (control) or treated with BAPTA and dropped onto stimulatory coverslips in a medium containing EGTA (BAPTA), and fixed 2 and 5 min after dropping. Cells were then permeabilized and immunostained with pTyr and pLAT. Scale bar equals 2 μm. b Cluster area and c cluster intensity of pLAT microclusters were quantified. d Jurkat cells transfected with LAT-ruby were treated with DMSO and dropped onto stimulatory coverslips in a medium containing DMSO (control) or treated with nocodazole and dropped onto coverslips in a medium containing nocodazole (nocodazole) and fixed 2 and 5 min after dropping. Cells were then permeabilized and immunostained with pLAT. Scale bar equals 2 μm. e Cluster area and f cluster intensity of pLAT microclusters were quantified. See also Supplementary Figure 1
Fig. 2
Fig. 2
Microcluster formation precedes VAMP7 recruitment as visualized by TIRF microscopy. a Jurkat cells transfected with LAT-RFP and GFP-VAMP7 were dropped onto stimulatory coverslips and imaged by TIRF microscopy. b Intensity profile of LAT-RFP and GFP-VAMP7 over time. c Time of appearance of LAT-RFP or GFP-VAMP7 signal in TIRF field (n = 12 cells, three independent experiments). d Jurkat cells transfected with Grb2-apple and emerald-VAMP7 were dropped onto stimulatory coverslips and imaged by TIRF microscopy (n = 10 cells, three independent experiments). a, d Top panels show LAT and Grb2, respectively, and arrows point to early microclusters; bottom panels show VAMP7, and arrowheads point to vesicles touching down. Scale bars = 2 μm
Fig. 3
Fig. 3
Spatial and temporal dynamics of LAT and VAMP7 visualized by lattice light sheet microscopy. a Jurkat cells transfected with LAT-neon green (green) and Halo-VAMP7 (red) were dropped onto stimulatory coverslips and imaged by lattice light sheet microscopy soon after activation. t0 indicates the first time point of image collection. The top panel shows the side view of the cell. The arrowhead indicates LAT microclusters and the arrow indicates VAMP7 vesicles that colocalize with vesicular LAT. Scale bar equals 2 μm. The bottom panel shows en face view of the activated surface (n = 5 cells, three independent experiments). b The left panel shows surfaces of LAT clusters (green) and VAMP7 vesicles (red). The middle panel shows individual vesicles marked as spots (cyan and pink) within VAMP7 surfaces. The panel to the right shows distances of VAMP7 spots from LAT clusters followed over time. The vesicles are color-coded to indicate distance in μm from activated LAT. c The panel to the left shows the graph of distances of individual VAMP7 vesicles from LAT clusters over time. Vesicles are color-coded to indicate distance in μm from activated LAT as in b. To the right is the zoomed-in view of the white boxed region indicated in the graph. d Jurkat cells transfected with LAT-neon green (green) and Halo-VAMP7 (red) were incubated with SEE-coated Raji B cells (blue) and immune synapse formation was visualized by lattice light sheet microscopy. t0 indicates the first time point of image collection. The top panel shows the side view of the cell. The arrowhead indicates LAT aggregated at immune synapse 1, and the arrow indicates VAMP7 vesicles. At t231, the T cells begin to interact with a second Raji B cell. The second synapse is indicated with an indented arrowhead (synapse 2). Scale bar equals 2 μm. The middle panel shows en face view of synapse 1 showing LAT accumulation at the immune synapse before the appearance of VAMP7 vesicles at t231. The bottom panel shows en face view of synapse 2 (n = 5 cells, three independent experiments). See also Supplementary Figure 2
Fig. 4
Fig. 4
Correlative 3D light and FIB-SEM of activated T cells. Jurkat cells transfected with emerald-VAMP7 (green) were dropped onto stimulatory coverslips and fixed after 2 min ah or 5 min in of activation and immunostained for pLAT (red), nucleus (blue), and plasma membrane (purple). a Images were collected of the whole cell activated for 2 min using confocal microscopy. Box 1 indicates a region with a pLAT microcluster and Box 2 indicates a region with VAMP7 vesicles. b Focused ion beam scanning electron microscopy (FIB-SEM) images were subsequently collected from the same samples. Scale bars for a and b equal 2 μm. c, f Zoomed-in FIB-SEM image of ROI 1 and ROI 2, respectively, showing a single slice. Scale bars for c and f equal 0.5 μm. d, g Zoomed-in FIB-SEM stacks corresponding to ROI 1 and 2, respectively. Corresponding FIB-SEM stacks are in Supplementary Movies 8 and 10, respectively. e, h Segmented FIB-SEM volumes corresponding to ROI 1 and 2, respectively; correspond to Supplementary Movies 9 and 11, respectively. i Images were collected through the whole cell activated for 5 min using confocal microscopy. Box 1 indicates a region with a pLAT microcluster in proximity of VAMP7 signal and Box 2 indicates a pLAT microcluster devoid of VAMP7 signal. j Focused ion beam scanning electron microscopy (FIB-SEM) images were subsequently collected from the same samples. Scale bars for i and j equal 2 μm. k, m Zoomed-in FIB-SEM image of ROI 1 and 2, respectively, showing a single slice. The arrowheads indicate subsynaptic vesicles. Scale bars for k and m equal 0.5 μm. Corresponding FIB-SEM stacks are in Supplementary Movies 12 and 13, respectively. l, n Segmented FIB-SEM volumes corresponding to ROI 1 and 2, respectively; see Supplementary Movies 14 and 15 (n = 3 cells for 2 min; 3 cells for 5 min, two independent experiments). See also Supplementary Figure 3
Fig. 5
Fig. 5
VAMP7 vesicles track between microclusters on microtubules at later times after activation. Jurkat cells transfected with indicated constructs were dropped onto stimulatory coverslips and imaged by TIRF-SIM 5 min after initial stimulation. ae Jurkat cells were transfected with ZAP-70-apple and emerald-VAMP7. a Image of the entire cell. Scale bar equals 2 μm. b, c Zoomed-in images focusing on a single VAMP7 vesicle and a few ZAP-70 microclusters. b shows a vesicle tracking on a microcluster; c shows a vesicle tracking between multiple microclusters (n = 7 cells, three independent experiments). Scale bars for b and c equal 0.2 μm. d Zoomed-in area of a region of interest of a cell in which vesicles (red) and microclusters (green) have been segmented and show two tracks of VAMP7 vesicles moving between ZAP70 clusters. To the right are time plots of the tracks shown in d indicating when colocalization (coloc) or no colocalization (no coloc) between VAMP7 and ZAP-70 was observed. e Spatiotemporal map of an entire cell with ZAP-70 microclusters in gray and VAMP7 tracks in yellow (when they colocalized with ZAP-70) or purple (when no colocalization was observed). f Graph of the percentage of vesicles per cell associated with microclusters and the frames that a vesicle was associated with a microcluster in the lifetime of its appearance in the TIRF field. g Jurkat cells were transfected with EMTB-GFP, Grb2-apple, and Halo-VAMP7. Image of the entire cell. Scale bar equals 2 μm. h, i Zoomed-in image focusing on a single tracked VAMP7 vesicle. h shows a vesicle tracking on a microtubule; i shows a vesicle tracking on a microtubule between two Grb2 microclusters indicated by indented arrowheads (n = 5 cells, three independent experiments). Scale bars for h and i equal 0.2 μm. In b, c, h, and i, the tracked vesicle is indicated as a gray sphere. The entire track is shown and color-coded to indicate time (earliest time point in blue and the latest time point in red). In the first panel, the entire track is shown. The remaining panels show four time points, each with a track that displays the previous five time points in b and c or previous 20 time points in h and i
Fig. 6
Fig. 6
LAT and VAMP7 dynamics at later times after activation. Lattice light sheet images of Jurkat cells transfected with LAT-neon green and Halo-VAMP7, dropped onto stimulatory coverslips, and imaged 5 min after initial stimulation. a, b The left panel shows the side view of the entire cell. The boxed region highlights a vesicle track. The tracked vesicle is a gray sphere. The entire track is shown and color-coded to indicate time, with the earliest time point in blue and the latest time point in red. Right panels show zoomed-in views of the vesicle. The top panel shows LAT (green) and VAMP7 (red), while the bottom panel shows LAT only. a A VAMP7 vesicle moving from the inside of the cell to the stimulated surface is shown and in b a VAMP7 vesicle moving from the center of the cell to the periphery is shown. In b white indented arrowheads in t25 top panel indicate two VAMP7 vesicles that fuse. White arrowheads in t28, t32, and t35 indicate the plasma membrane lifting up. Scale bars for a and b left panels equal 2 μm and right panels equal 0.5 μm. c Segmented VAMP7 (red) and LAT (green) at a flare event corresponding to t32 in b. d Relative fluorescence intensity (RFI) plots of VAMP7 (red) and LAT (green) intensity sums within the segmented VAMP7 vesicle shown in c over time. Gray arrowheads indicate the times that show the “flare” event. e Speed of VAMP7 vesicles away from and at the site of a flare were graphed. f, h Zoomed-in views of VAMP7 vesicles showing an increase in LAT fluorescence at the vesicle tip as it touches down on the plasma membrane. Scale bars equal 0.5 μm. g, i Top panels show time series showing LAT and VAMP7 increases in an en face view of the plasma membrane. Lower panels show relative fluorescence intensity (RFI) plots of VAMP7 (red) and LAT (green) (n = 5 cells, three independent experiments). See also Supplementary Figure 4
Fig. 7
Fig. 7
Microcluster composition before and after VAMP7 recruitment. ac Jurkat cells were transfected with a LAT-Halo, Grb2-scarlet, and emerald-VAMP7, b LAT-ruby, PLCγ1-Halo, and emerald-VAMP7, or c LAT-ruby, SLP76-Halo, and emerald-VAMP7, dropped onto stimulatory coverslips, and imaged by TIRF microscopy. Indicated time points are shown with t0 corresponding to the earliest observable time point. For each time point, the upper-right image was magnified from the region marked by a white box in the left image, and the bottom-right graph shows the relative fluorescence intensity (RFI) measured across the width of the white line in the corresponding upper-right image. ac Scale bars in left images equal 2 μm. Scale bars in upper-right images equal 0.5 μm (n = 6 cells for Grb2, 4 cells for PLCγ1 and SLP-76; three independent experiments). d, e Left panels show time-lapse montage at 3 s/frame graphs of a single microcluster and kinetics of recruitment of LAT, Grb2, and VAMP7. On the right, relative fluorescence intensity (RFI) plots of the time-lapse montage are shown. Blue arrowheads indicate peak VAMP7 fluorescence, red arrowheads indicate peak Grb2 fluorescence (d) or increased Grb2 fluorescence once VAMP7 is recruited (e) and green arrowheads indicate peak LAT fluorescence (d) or increased LAT fluorescence post VAMP7 recruitment (e). Scale bars equal 0.5 μm. See also Supplementary Figure 5
Fig. 8
Fig. 8
Two-phase model for LAT activation. A model for LAT microcluster formation and maintenance using the two cellular pools of LAT is shown. a The left panel shows that at early time points, LAT vesicles decorated with VAMP7 are several microns away from the immune synapse, while plasma membrane-resident LAT can move laterally to be recruited to microclusters. The middle and right panels show that microtubule polarization toward the immunological synapse causes the reorientation of various vesicular compartments to the subsynaptic zone. b, c Zoomed-in regions of early and late stages of activation, respectively. b At early time points, plasma membrane LAT is recruited to microclusters and activated ZAP-70 phosphorylates LAT at the PM. c At later time points, LAT/VAMP7 vesicles are recruited to the immune synapse, move in a directed manner between microclusters, and interact dynamically with microclusters

References

    1. Yan Q, et al. Structural basis for activation of ZAP-70 by phosphorylation of the SH2-kinase linker. Mol. Cell. Biol. 2013;33:2188–2201. doi: 10.1128/MCB.01637-12. - DOI - PMC - PubMed
    1. Balagopalan L, Kortum RL, Coussens NP, Barr VA, Samelson LE. The linker for activation of T cells (LAT) signaling hub: from signaling complexes to microclusters. J. Biol. Chem. 2015;290:26422–26429. doi: 10.1074/jbc.R115.665869. - DOI - PMC - PubMed
    1. Bunnell SC, et al. T cell receptor ligation induces the formation of dynamically regulated signaling assemblies. J. Cell Biol. 2002;158:1263–1275. doi: 10.1083/jcb.200203043. - DOI - PMC - PubMed
    1. Yokosuka T, et al. Newly generated T cell receptor microclusters initiate and sustain T cell activation by recruitment of Zap70 and SLP-76. Nat. Immunol. 2005;6:1253–1262. doi: 10.1038/ni1272. - DOI - PubMed
    1. Bonello G, et al. Dynamic recruitment of the adaptor protein LAT: LAT exists in two distinct intracellular pools and controls its own recruitment. J. Cell Sci. 2004;117:1009–1016. doi: 10.1242/jcs.00968. - DOI - PubMed

Publication types

MeSH terms