. 2018 Dec;32(12):2604-2616.
doi: 10.1038/s41375-018-0037-9. Epub 2018 May 22.

Analysis of the genomic landscape of multiple myeloma highlights novel prognostic markers and disease subgroups

Affiliations

Analysis of the genomic landscape of multiple myeloma highlights novel prognostic markers and disease subgroups

Niccolo Bolli et al. Leukemia. 2018 Dec.

Abstract

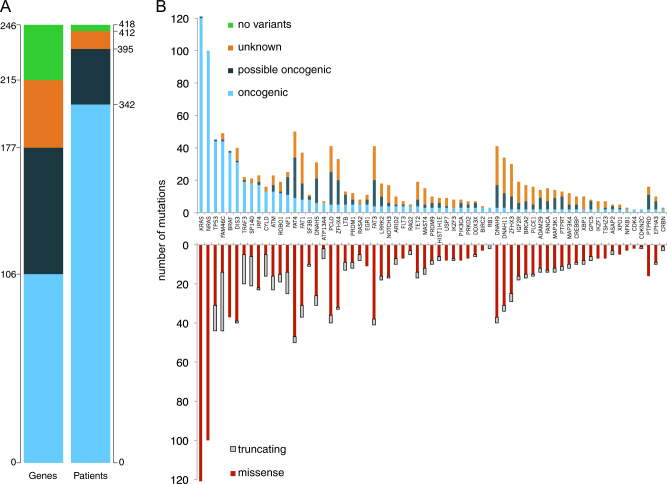
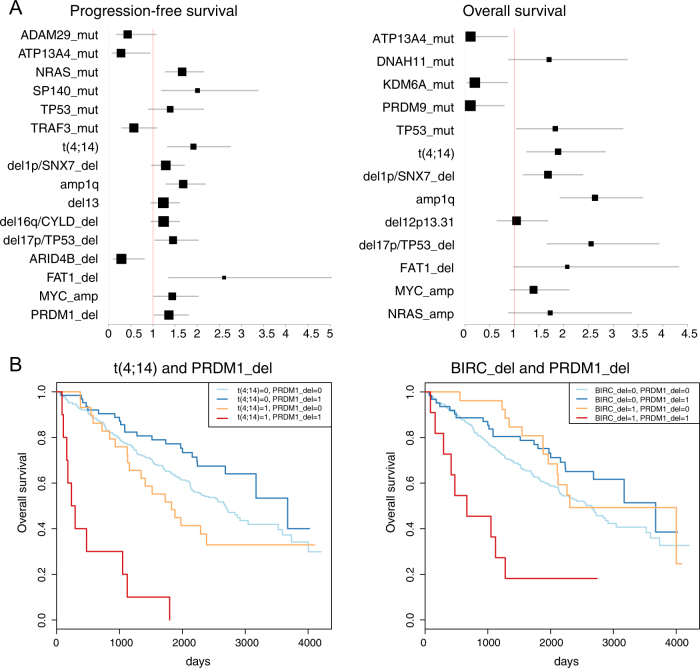
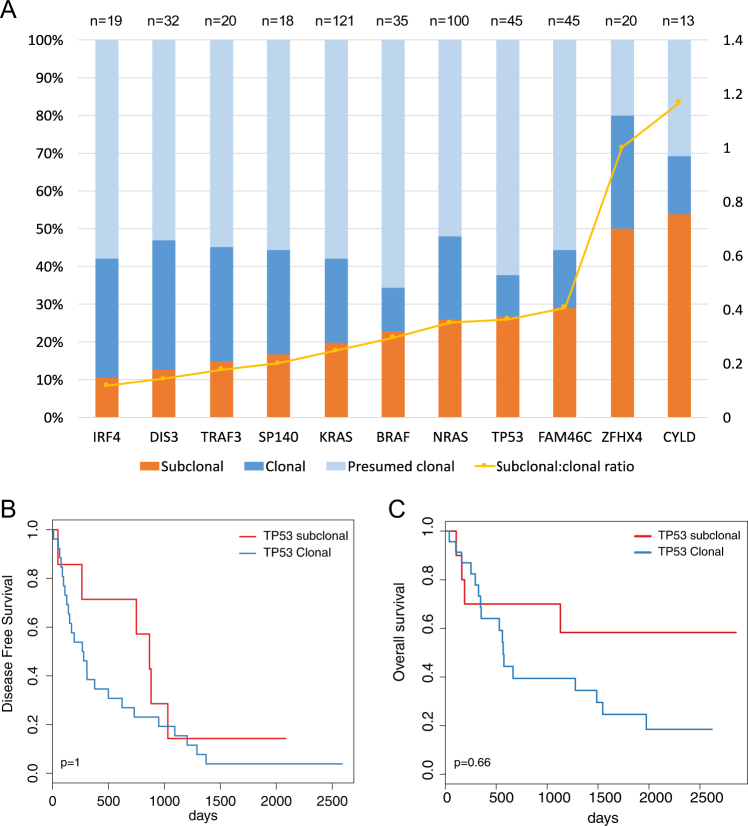
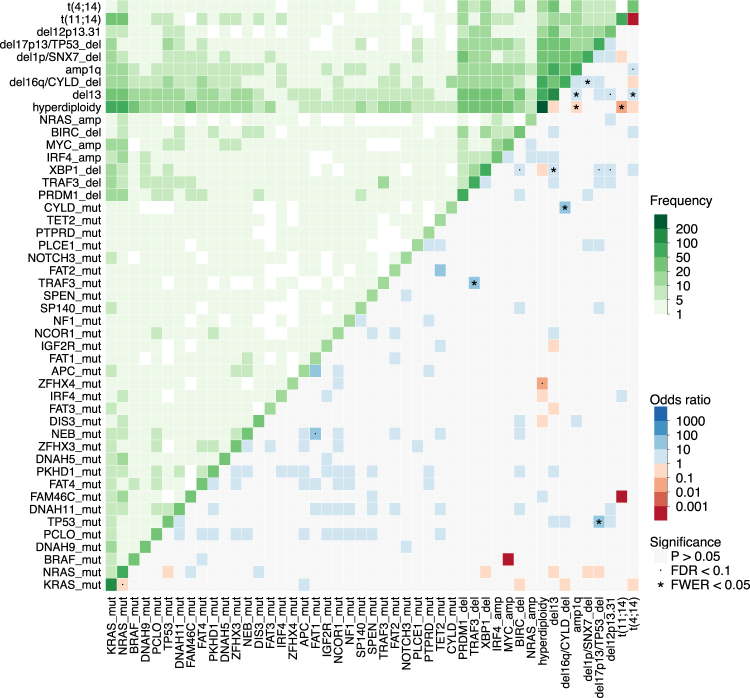
In multiple myeloma, next-generation sequencing (NGS) has expanded our knowledge of genomic lesions, and highlighted a dynamic and heterogeneous composition of the tumor. Here we used NGS to characterize the genomic landscape of 418 multiple myeloma cases at diagnosis and correlate this with prognosis and classification. Translocations and copy number abnormalities (CNAs) had a preponderant contribution over gene mutations in defining the genotype and prognosis of each case. Known and novel independent prognostic markers were identified in our cohort of proteasome inhibitor and immunomodulatory drug-treated patients with long follow-up, including events with context-specific prognostic value, such as deletions of the PRDM1 gene. Taking advantage of the comprehensive genomic annotation of each case, we used innovative statistical approaches to identify potential novel myeloma subgroups. We observed clusters of patients stratified based on the overall number of mutations and number/type of CNAs, with distinct effects on survival, suggesting that extended genotype of multiple myeloma at diagnosis may lead to improved disease classification and prognostication.


Conflict of interest statement

The authors declare that they have no conflict of interest.

Figures

Fig. 1
Fig. 1
Absolute number of mutations in the study: a Left: absolute numbers of genes with at least one mutation of the specified class found in the study. Right: Number of patients carrying at least one mutation of the specified class. Oncogenic variants: light blue. Possible oncogenic variants: dark blue. Variants of unknown significance: orange. No variants identified: green. b Top: stacked bar chart of mutations in the study, limited to genes with >2 oncogenic mutations, broken down by mutation class. Bottom: For the same genes, missense variants are in red, truncating variants are in gray
Fig. 2
Fig. 2
The genomic landscape of multiple myeloma: a Pie chart of the breakdown of samples in the study, classified based on the presumed founder cytogenetic abnormalities: hyperdiploidy and IGH translocations. HDMM hyperdiploid multiple myeloma, NA not available for analysis, None no cytogenetic event identified. IGH_Tx translocation involving the IGH region. b Bar chart of the prevalence of each class of alteration (copy number abnormalities -CNA-, karyotype, gene-level copy number abnormalities, gene mutations) in samples in the study. c Stacked bar chart of the most frequent genomic events of any class, broken down by cytogenetic group
Fig. 3
Fig. 3
Independent variants affecting survival: a Forest plot of variables implicated in progression-free survival (left) and overall survival (right). Hazard ratio on the X axis, values <1 confer better prognosis, values >1 confer worse prognosis. For each variable, the confidence interval is a horizontal gray bar and the hazard ratio—referenced to the X-axis—is represented by a black box. b Kaplan–Meier survival curves for two significant instances of interaction found in the study: prognosis for overall survival is significantly worse in case of coexistence of PRDM1 deletions and t(4;14) (left) or PRDM1 deletions and BIRC2/3 deletions (right) than with either variable alone
Fig. 4
Fig. 4
Subclonal mutations: a Stacked bar chart of the clonality status of the top 11 mutated genes in our cohort: bars refer to the left Y-axis and plotted is the proportion of variants that are subclonal (orange), clonal (dark blue) and presumed clonal (light blue)—i.e., cases where confidence intervals of aVAF are all overlapping and low tumor purity could lead to over-estimation of clonality. The yellow line refers to the right Y-axis and represents, for each gene, the ratio between subclonal and clonal variants, i.e., higher values correspond to genes with more subclonal variants. (b)Kaplan–Meier plot of progression-free survival in patients with subclonal (red) or clonal (blue) TP53 mutations with p-values from univariate analysis (log-rank test) adjusted for multiple hypotheses testing. c Kaplan–Meier plot of overall survival in patients with subclonal (red) or clonal (blue) TP53 mutations with p-values from univariate analysis (log-rank test) adjusted for multiple hypotheses testing
Fig. 5
Fig. 5
Pairwise association between variables: Heatmap showing pairwise analysis of occurrence of the most frequent genomic events in MM. The same variable is plotted in the X and Y axis, and the intensity of color in the leading diagonal indicated the frequency of the variable in the dataset. In the upper triangle, intensity of green indicates the frequency of co-occurrence of any two variables. In the lower triangle, associations are colored by odds ratio: non-significant ones are in gray, while significant ones are in blue if co-occurring, and red if mutually exclusive (p-value < 0.05, fisher test corrected for multiple hypothesis testing). Events with false-discovery rate <0.1 are marked with a dot and events with family-wise error rate <0.05 are marked with a star. While only 47 variables are shown, statistical significance is computed on the full dataset of 192 variables shown in Supplementary Figure 10
Fig. 6
Fig. 6
Clustering of myeloma samples based on genomic landscape: a Bayesian Dirichlet clustering process of the 418 MM cases (in columns) based on genomic variables (in rows, top panel), with verticals black lines showing separation between identified clusters. A zoomed in view for the karyotypic abnormalities is provided in the bottom panel. Cluster 1 is composed of three patients where no driver event could be identified. b For each of the four clusters, the histogram of the distribution of gene mutations (top) and that of the CNAs (bottom) are provided. c Progression-free (left) and overall survival (right) Kaplan–Meier analysis of the four clusters

References

    1. Palumbo A, Anderson K. Multiple myeloma. N Engl J Med. 2011;364:1046–60. doi: 10.1056/NEJMra1011442. - DOI - PubMed
    1. Morgan GJ, Walker BA, Davies FE. The genetic architecture of multiple myeloma. Nat Rev Cancer. 2012;12:335–48. doi: 10.1038/nrc3257. - DOI - PubMed
    1. Corre J, Munshi N, Avet-Loiseau H. Genetics of multiple myeloma: another heterogeneity level? Blood. 2015;125:1870–6. doi: 10.1182/blood-2014-10-567370. - DOI - PMC - PubMed
    1. Fonseca R, Leif Bergsagel PL, Drach J, Shaughnessy J, Gutierrez N, Stewart AK, et al. International Myeloma Working Group molecular classification of multiple myeloma: spotlight review. Leukemia. 2009;23:2210–21. doi: 10.1038/leu.2009.174. - DOI - PMC - PubMed
    1. Zingone A, Kuehl WM. Pathogenesis of monoclonal gammopathy of undetermined significance and progression to multiple myeloma. Semin Hematol. 2011;48:4–12. doi: 10.1053/j.seminhematol.2010.11.003. - DOI - PMC - PubMed

Publication types

Substances