EpiProfile 2.0: A Computational Platform for Processing Epi-Proteomics Mass Spectrometry Data
- PMID: 29790754
- PMCID: PMC6387837
- DOI: 10.1021/acs.jproteome.8b00133
EpiProfile 2.0: A Computational Platform for Processing Epi-Proteomics Mass Spectrometry Data
Abstract
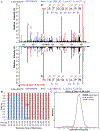
Epigenetics has become a fundamental scientific discipline with various implications for biology and medicine. Epigenetic marks, mostly DNA methylation and histone post-translational modifications (PTMs), play important roles in chromatin structure and function. Accurate quantification of these marks is an ongoing challenge due to the variety of modifications and their wide dynamic range of abundance. Here we present EpiProfile 2.0, an extended version of our 2015 software (v1.0), for accurate quantification of histone peptides based on liquid chromatography-tandem mass spectrometry (LC-MS/MS) analysis. EpiProfile 2.0 is now optimized for data-independent acquisition through the use of precursor and fragment extracted ion chromatography to accurately determine the chromatographic profile and to discriminate isobaric forms of peptides. The software uses an intelligent retention time prediction trained on the analyzed samples to enable accurate peak detection. EpiProfile 2.0 supports label-free and isotopic labeling, different organisms, known sequence mutations in diseases, different derivatization strategies, and unusual PTMs (such as acyl-derived modifications). In summary, EpiProfile 2.0 is a universal and accurate platform for the quantification of histone marks via LC-MS/MS. Being the first software of its kind, we anticipate that EpiProfile 2.0 will play a fundamental role in epigenetic studies relevant to biology and translational medicine. EpiProfile is freely available at https://github.com/zfyuan/EpiProfile2.0_Family .
Keywords: acylation; epigenetics; histone; mutations; post-translational modification; quantification.
Figures


References
-
- Kouzarides T, Chromatin modifications and their function. Cell 2007, 128, (4), 693–705. - PubMed
-
- Cheung P, Generation and characterization of antibodies directed against di-modified histones, and comments on antibody and epitope recognition. Methods Enzymol 2004, 376, 221–34. - PubMed
-
- Egelhofer TA; Minoda A; Klugman S; Lee K; Kolasinska-Zwierz P; Alekseyenko AA; Cheung MS; Day DS; Gadel S; Gorchakov AA; Gu T; Kharchenko PV; Kuan S; Latorre I; Linder-Basso D; Luu Y; Ngo Q; Perry M; Rechtsteiner A; Riddle NC; Schwartz YB; Shanower GA; Vielle A; Ahringer J; Elgin SC; Kuroda MI; Pirrotta V; Ren B; Strome S; Park PJ; Karpen GH; Hawkins RD; Lieb JD, An assessment of histone-modification antibody quality. Nat Struct Mol Biol 2011, 18, (1), 91–3. - PMC - PubMed
-
- Aebersold R; Mann M, Mass spectrometry-based proteomics. Nature 2003, 422, (6928), 198–207. - PubMed
Publication types
MeSH terms
Substances
Grants and funding
LinkOut - more resources
Full Text Sources
Other Literature Sources
Miscellaneous

