. 2018 Sep 1;120(3):998-1009.
doi: 10.1152/jn.00783.2017. Epub 2018 May 23.

Modulation of spinal motor networks by astrocyte-derived adenosine is dependent on D1-like dopamine receptor signaling

Affiliations

Modulation of spinal motor networks by astrocyte-derived adenosine is dependent on D1-like dopamine receptor signaling

David Acton et al. J Neurophysiol. .

Abstract

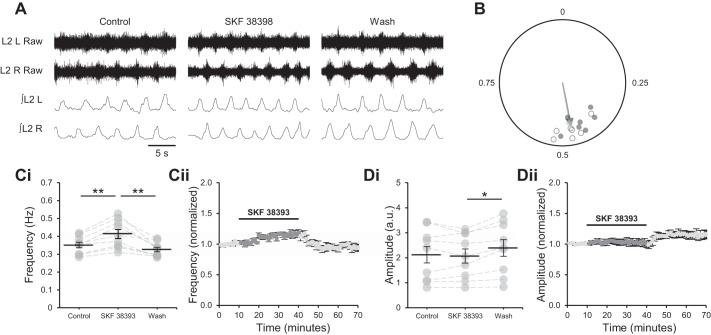
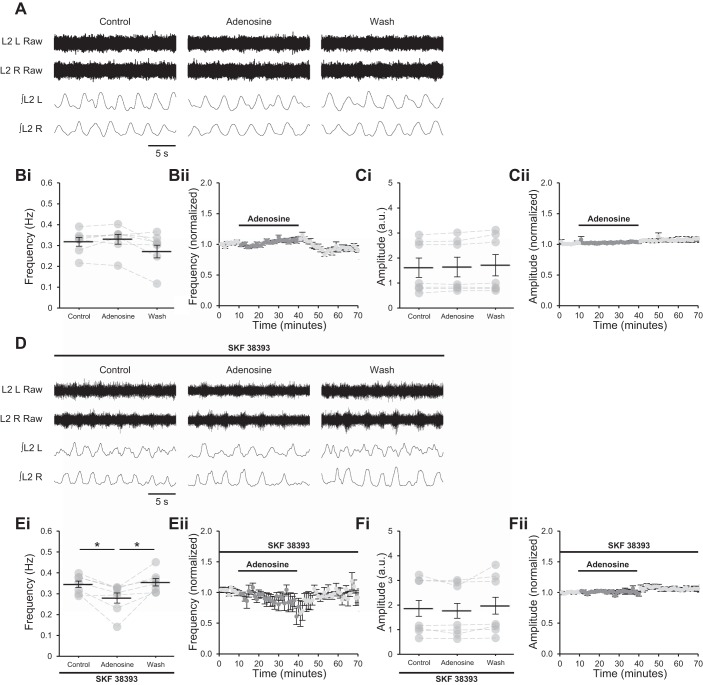
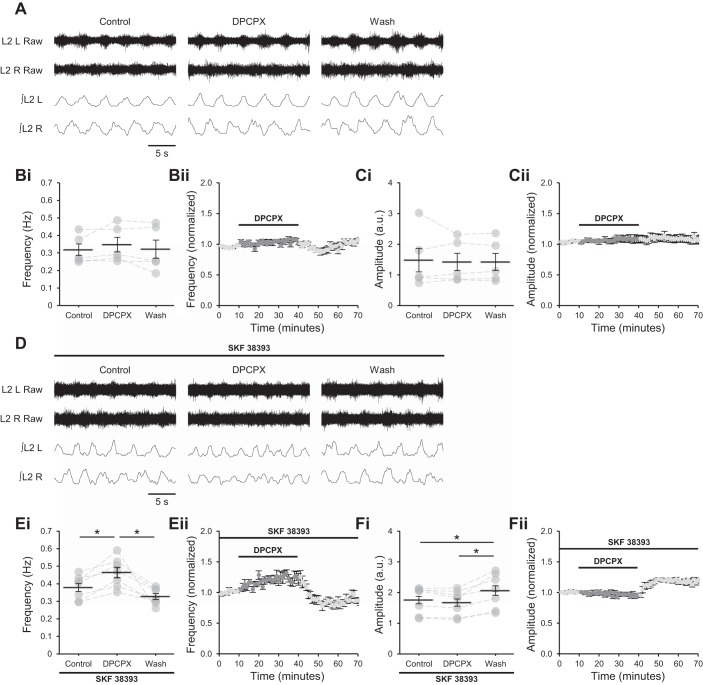
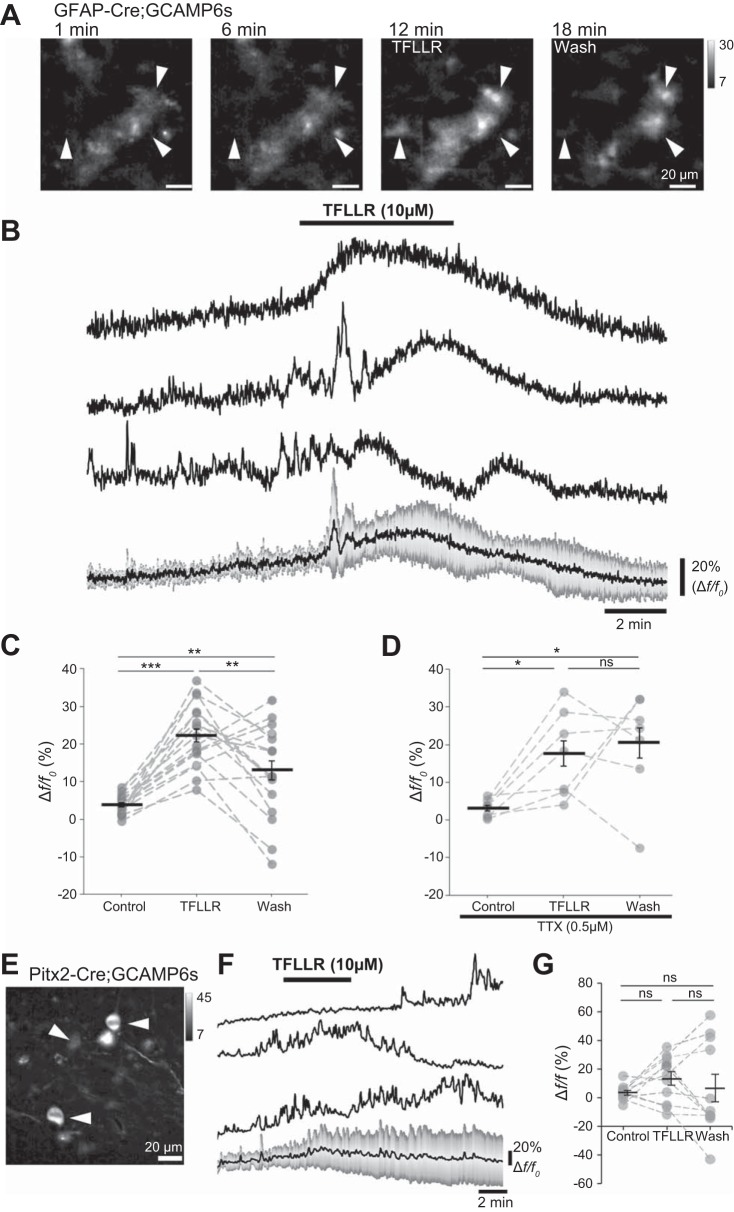
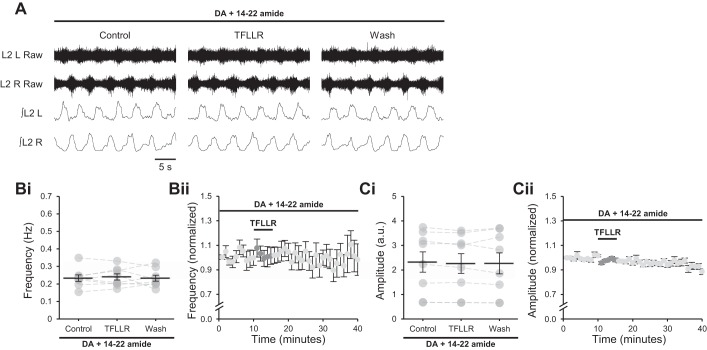
Astrocytes modulate many neuronal networks, including spinal networks responsible for the generation of locomotor behavior. Astrocytic modulation of spinal motor circuits involves release of ATP from astrocytes, hydrolysis of ATP to adenosine, and subsequent activation of neuronal A1 adenosine receptors (A1Rs). The net effect of this pathway is a reduction in the frequency of locomotor-related activity. Recently, it was proposed that A1Rs modulate burst frequency by blocking the D1-like dopamine receptor (D1LR) signaling pathway; however, adenosine also modulates ventral horn circuits by dopamine-independent pathways. Here, we demonstrate that adenosine produced upon astrocytic stimulation modulates locomotor-related activity by counteracting the excitatory effects of D1LR signaling and does not act by previously described dopamine-independent pathways. In spinal cord preparations from postnatal mice, a D1LR agonist, SKF 38393, increased the frequency of locomotor-related bursting induced by 5-hydroxytryptamine and N-methyl-d-aspartate. Bath-applied adenosine reduced burst frequency only in the presence of SKF 38393, as did adenosine produced after activation of protease-activated receptor-1 to stimulate astrocytes. Furthermore, the A1R antagonist 8-cyclopentyl-1,3-dipropylxanthine enhanced burst frequency only in the presence of SKF 38393, indicating that endogenous adenosine produced by astrocytes during network activity also acts by modulating D1LR signaling. Finally, modulation of bursting by adenosine released upon stimulation of astrocytes was blocked by protein kinase inhibitor-(14-22) amide, a protein kinase A (PKA) inhibitor, consistent with A1R-mediated antagonism of the D1LR/adenylyl cyclase/PKA pathway. Together, these findings support a novel, astrocytic mechanism of metamodulation within the mammalian spinal cord, highlighting the complexity of the molecular interactions that specify motor output. NEW & NOTEWORTHY Astrocytes within the spinal cord produce adenosine during ongoing locomotor-related activity or when experimentally stimulated. Here, we show that adenosine derived from astrocytes acts at A1 receptors to inhibit a pathway by which D1-like receptors enhance the frequency of locomotor-related bursting. These data support a novel form of metamodulation within the mammalian spinal cord, enhancing our understanding of neuron-astrocyte interactions and their importance in shaping network activity.

Keywords: PAR1; central pattern generator; gliotransmission; metamodulation; motor control; neuromodulation.


Figures

Fig. 1.
Fig. 1.
Activation of D1-like dopamine receptors (D1LRs) increases the frequency but not the amplitude of locomotor-related activity. A: raw (top) and rectified/integrated (bottom) traces recorded from left (L) and right (R) L2 ventral roots showing the effect of the selective agonist of D1LRs SKF 38393 (100 nM) on locomotor-related activity induced by 5-hydroxytryptamine (5-HT; 10 µM) and N-methyl-d-aspartate (NMDA; 5 µM). B: left-right phase relationship in control conditions and during application of SKF 38393. Data points represent the onset of locomotor bursts recorded from RL2 ventral roots in relation to the onset of activity recorded from corresponding LL2 roots (assigned a value of 0) in the same cycle. Circles represent mean values from individual experiments during control conditions (open) and during application of SKF 38393 (filled). Arrows represent means for all preparations (control, light gray; drug, dark gray). Vector direction indicates mean phase, and vector length corresponds to clustering of data points around the mean. n = 7 preparations. Ci: locomotor burst frequency over 5 min during a control period, during a 30-min application of SKF 38393, and during a 30-min washout. Individual data points are shown in gray, and means are represented by black lines. n = 9. Cii: time course plot of normalized data aggregated into 1-min bins showing an increase in burst frequency during SKF 38393 application. n = 9. Di: locomotor burst amplitude over 5 min during a control period, during a 30-min application of SKF 38393, and during a 30-min washout. n = 9. a.u., Arbitrary units. Dii: time course plot of normalized data aggregated into 1-min bins showing no change in burst amplitude during SKF 38393 application. n = 9. Error bars show ±SE. Statistically significant difference: *P < 0.05, **P < 0.01.
Fig. 2.
Fig. 2.
Adenosine requires activation of D1-like dopamine receptors (D1LRs) to modulate locomotor-related activity. A: raw (top) and rectified/integrated (bottom) traces recorded from left (L) and right (R) L2 ventral roots showing the effect of adenosine (75 µM) on locomotor-related activity induced by 5-hydroxytryptamine (5-HT; 10 µM) and N-methyl-d-aspartate (NMDA; 5 µM). Bi: locomotor burst frequency over 5 min during a control period, during a 30-min application of adenosine, and during a 30-min washout. Individual data points are shown in gray, and means are represented by black lines. n = 7 preparations. Bii: time course plot of normalized data aggregated into 1-min bins showing no change in burst frequency during adenosine application. n = 7. Ci: locomotor burst amplitude over 5 min during a control period, during a 30-min application of adenosine, and during a 30-min washout. n = 7. a.u., Arbitrary units. Cii: time course plot of normalized data aggregated into 1-min bins showing no change in burst amplitude during adenosine application. n = 7. D: raw (top) and rectified/integrated (bottom) traces recorded from LL2 and RL2 ventral roots showing the effect of adenosine on locomotor-related activity induced by 5-HT and NMDA in the presence of the selective agonist of D1LRs SKF 38393 (100 nM). Ei: locomotor burst frequency over 5 min during a control period, during a 30-min application of adenosine, and during a 30-min washout. SKF 38393 was present throughout. n = 7. Eii: time course plot of normalized data aggregated into 1-min bins showing a reduction in burst frequency during adenosine application in the presence of SKF 38393. n = 7. Fi: locomotor burst amplitude over 5 min during a control period, during a 30-min application of adenosine, and during a 30-min washout. SKF 38393 was present throughout. n = 7. Fii: time course plot of normalized data aggregated into 1-min bins showing no change in burst amplitude during adenosine application in the presence of SKF 38393. n = 7. Error bars show ±SE. Statistically significant difference: *P < 0.05.
Fig. 3.
Fig. 3.
A1 adenosine receptors require activation of D1-like dopamine receptors (D1LRs) to modulate locomotor-related activity. A: raw (top) and rectified/integrated (bottom) traces recorded from left (L) and right (R) L2 ventral roots showing the effect of the selective A1 antagonist 8-cyclopentyl-1,3-dipropylxanthine (DPCPX; 1 µM) on locomotor-related activity induced by 5-hydroxytryptamine (5-HT; 10 µM) and N-methyl-d-aspartate (NMDA; 5 µM). Bi: locomotor burst frequency over 5 min during a control period, during a 30-min application of DPCPX (1–50 µM), and during a 30-min washout. Individual data points are shown in gray, and means are represented by black lines. n = 5 preparations. Bii: time course plot of normalized data aggregated into 1-min bins showing no change in burst frequency during DPCPX application. n = 5. Ci: locomotor burst amplitude over 5 min during a control period, during a 30-min application of DPCPX, and during a 30-min washout. n = 5. a.u., Arbitrary units. Cii: time course plot of normalized data aggregated into 1-min bins showing no change in burst amplitude during DPCPX application. n = 5. D: raw (top) and rectified/integrated (bottom) traces recorded from LL2 and RL2 ventral roots showing the effect of DPCPX (1 µM) on locomotor-related activity induced by 5-HT and NMDA in the presence of the selective agonist of D1LRs SKF 38393 (100 nM). Ei: locomotor burst frequency over 5 min during a control period, during a 30-min application of DPCPX (1 µM), and during a 30-min washout. SKF 38393 was present throughout. n = 7. Eii: time course plot of normalized data aggregated into 1-min bins showing an increase in burst frequency during DPCPX application in the presence of SKF 38393. n = 7. Fi: locomotor burst amplitude over 5 min during a control period, during a 30-min application of DPCPX, and during a 30-min washout. SKF 38393 was present throughout. n = 7. Fii: time course plot of normalized data aggregated into 1-min bins showing no change in burst amplitude during DPCPX application in the presence of SKF 38393. n = 7. Error bars show ±SE. Statistically significant difference: *P < 0.05.
Fig. 4.
Fig. 4.
Protease-activated receptor-1 (PAR1) stimulation evokes Ca2+ signaling in spinal cord astrocytes. A: images of glial fibrillary acidic protein (GFAP)+ astrocytes expressing GCaMP6s in an acute spinal cord slice from a postnatal day (P)7 mouse (hGFAP::Cre;GCAMP6s), showing elevated intracellular Ca2+ after activation of PAR1 by TFLLR-NH2 (TFLLR; 10 µM) added between 7 and 12 min. Arrowheads denote 3 cells for which traces are shown in B. B: traces showing changes in Ca2+ levels in 3 astrocytes (1–3) during the addition of TFLLR to activate PAR1 receptors. Traces are plotted as Δf/f0. Bottom: mean Δf/f0 for 7 cells, with gray bars depicting the SD. C: average Δf/f0 during control, TFLLR, and wash periods plotted for cells pooled across 2 experiments performed on 2 different mice (n = 17 cells). D: average Δf/f0 during control, TFLLR, and wash periods plotted for cells imaged in slices incubated in tetrodotoxin (TTX; 0.5 µM; n = 7 cells across 2 experiments performed on 2 different mice). E: Pitx2+ interneurons expressing Cre-driven GCAMP6s. F: traces showing Ca2+ levels during application of TFLLR in 3 interneurons from a Pitx2Cre;Ai96LSL-GCaMP6s animal and an averaged trace (bottom) from 11 cells (SD indicated in gray). G: average Δf/f0 values during control, TFLLR, and wash periods plotted for Pitx2+ interneurons from a Pitx2Cre;Ai96LSL-GCaMP6s animal (data pooled from 4 slices). Error bars show ±SE. Statistically significant difference: *P < 0.05, **P < 0.01, ***P < 0.001. ns, Not significant.
Fig. 5.
Fig. 5.
Adenosine released from astrocytes upon protease-activated receptor-1 (PAR1) activation requires activation of D1-like dopamine receptors (D1LRs) to modulate locomotor-related activity. A: raw (top) and rectified/integrated (bottom) traces recorded from left (L) and right (R) L2 ventral roots showing the effect of the PAR1 agonist TFLLR-NH2 (TFLLR; 10 µM) on locomotor-related activity induced by 5-hydroxytryptamine (5-HT; 10 µM) and N-methyl-d-aspartate (NMDA; 5 µM). Bi: locomotor burst frequency over 5 min during a control period, upon a 5-min application of TFLLR, and during a 25-min washout. Individual data points are shown in gray, and means are represented by black lines. n = 7 preparations. Bii: time course plot of normalized data aggregated into 1-min bins showing no change in burst frequency upon TFLLR application. n = 7. Ci: locomotor burst amplitude over 5 min during a control period, upon a 5-min application of TFLLR, and during a 25-min washout. n = 7. a.u., Arbitrary units. Cii: time course plot of normalized data aggregated into 1-min bins showing no change in burst amplitude upon TFLLR application. n = 7. D: raw (top) and rectified/integrated (bottom) traces recorded from LL2 and RL2 ventral roots showing the effect of TFLLR on locomotor-related activity induced by 5-HT and NMDA in the presence of the selective agonist of D1LRs SKF 38393 (100 nM). Ei: locomotor burst frequency over 5 min during a control period, upon a 5-min application of TFLLR, and during a 25-min washout. SKF 38393 was present throughout. n = 11. Eii: time course plot of normalized data aggregated into 1-min bins showing a transient reduction in burst frequency upon TFLLR application in the presence of SKF 38393. n = 11. Fi: locomotor burst amplitude over 5 min during a control period, upon a 5-min application of TFLLR, and during a 25-min washout. SKF 38393 was present throughout. n = 11. Fii: time course plot of normalized data aggregated into 1-min bins showing no change in burst amplitude upon TFLLR application in the presence of SKF 38393. n = 11. Error bars show ±SE. Statistically significant difference: **P < 0.01.
Fig. 6.
Fig. 6.
Adenosine released from astrocytes upon protease-activated receptor-1 (PAR1) activation requires protein kinase A (PKA) activity to modulate locomotor-related activity. A: raw (top) and rectified/integrated (bottom) traces recorded from left (L) and right (R) L2 ventral roots showing the effect of the PAR1 agonist TFLLR-NH2 (TFLLR; 10 µM) on locomotor-related activity induced by 5-hydroxytryptamine (5-HT; 10 µM), N-methyl-d-aspartate (NMDA; 5 µM) and dopamine (DA; 50 µM) in the presence of the PKA inhibitor protein kinase inhibitor-(14–22)-amide (14–22 amide; 1 µM). Bi: locomotor-burst frequency over 5 min during a control period, upon a 5-min application of TFLLR, and during a 25-min washout. Individual data points are shown in gray, and means are represented by black lines. n = 8 preparations. Bii: time course plot of normalized data aggregated into 1-min bins showing no change in burst frequency upon TFLLR application. n = 8. Ci: locomotor burst amplitude over 5 min during a control period, upon a 5-min application of TFLLR, and during a 25-min washout. n = 8. a.u., Arbitrary units. Cii: time course plot of normalized data aggregated into 1-min bins showing no change in burst amplitude upon TFLLR application. n = 8. Error bars show ±SE.

References

    1. Acevedo J, Santana-Almansa A, Matos-Vergara N, Marrero-Cordero LR, Cabezas-Bou E, Díaz-Ríos M. Caffeine stimulates locomotor activity in the mammalian spinal cord via adenosine A1 receptor-dopamine D1 receptor interaction and PKA-dependent mechanisms. Neuropharmacology 101: 490–505, 2016. doi:10.1016/j.neuropharm.2015.10.020. - DOI - PMC - PubMed
    1. Acton D, Miles GB. Stimulation of glia reveals modulation of mammalian spinal motor networks by adenosine. PLoS One 10: e0134488, 2015. doi:10.1371/journal.pone.0134488. - DOI - PMC - PubMed
    1. Acton D, Miles GB. Gliotransmission and adenosinergic modulation: insights from mammalian spinal motor networks. J Neurophysiol 118: 3311–3327, 2017. doi:10.1152/jn.00230.2017. - DOI - PMC - PubMed
    1. Araque A, Carmignoto G, Haydon PG, Oliet SH, Robitaille R, Volterra A. Gliotransmitters travel in time and space. Neuron 81: 728–739, 2014. doi:10.1016/j.neuron.2014.02.007. - DOI - PMC - PubMed
    1. Araque A, Parpura V, Sanzgiri RP, Haydon PG. Tripartite synapses: glia, the unacknowledged partner. Trends Neurosci 22: 208–215, 1999. doi:10.1016/S0166-2236(98)01349-6. - DOI - PubMed

Publication types

MeSH terms

Substances

LinkOut - more resources