. 2018 Nov 1;34(21):3702-3710.
doi: 10.1093/bioinformatics/bty409.

PyCoTools: a Python toolbox for COPASI

Affiliations

PyCoTools: a Python toolbox for COPASI

Ciaran M Welsh et al. Bioinformatics. .

Abstract

Motivation: COPASI is an open source software package for constructing, simulating and analyzing dynamic models of biochemical networks. COPASI is primarily intended to be used with a graphical user interface but often it is desirable to be able to access COPASI features programmatically, with a high level interface.

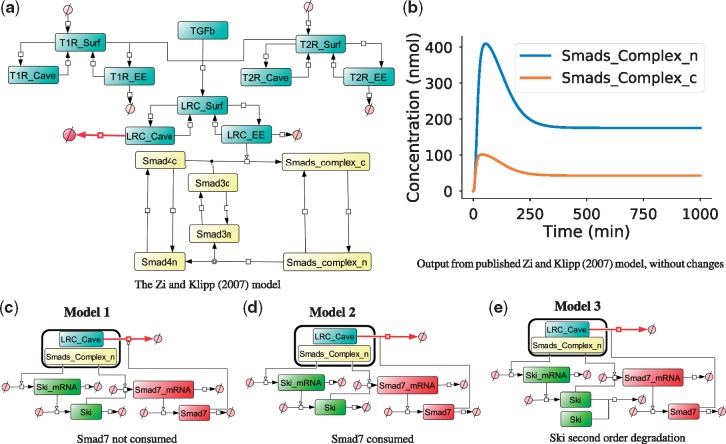
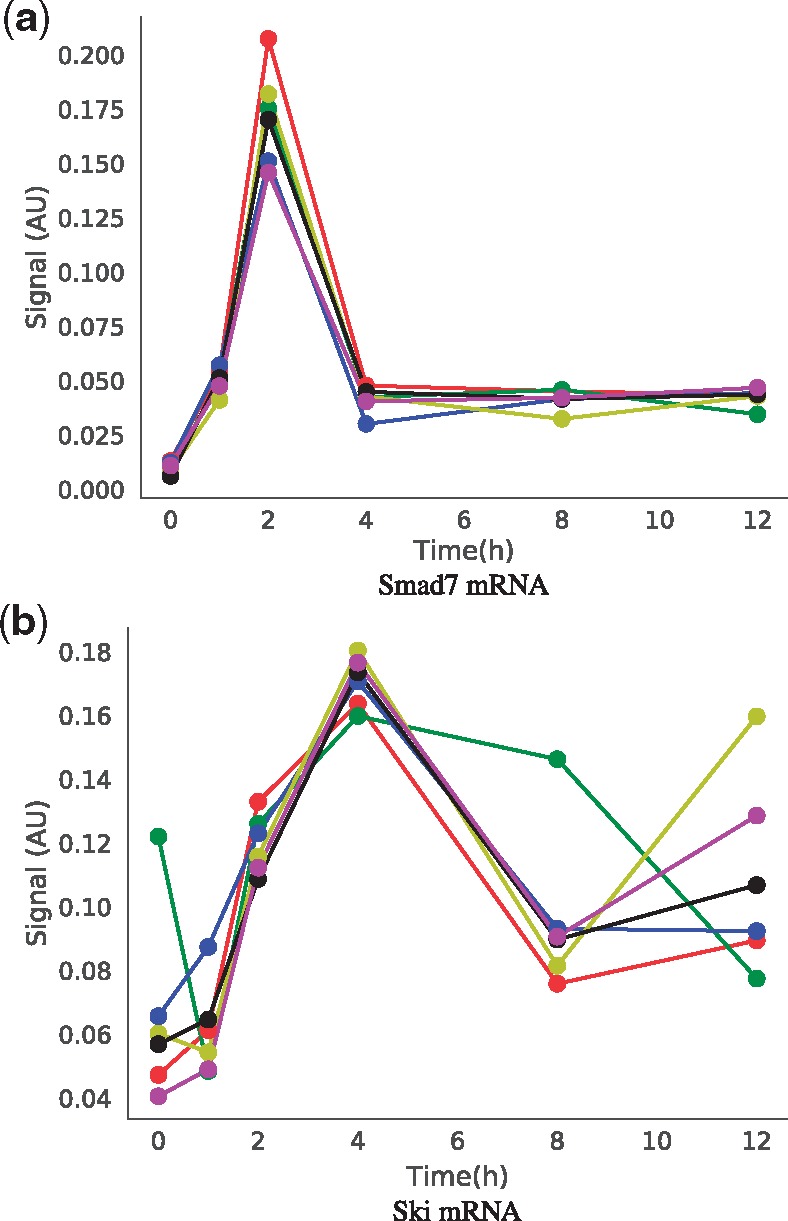
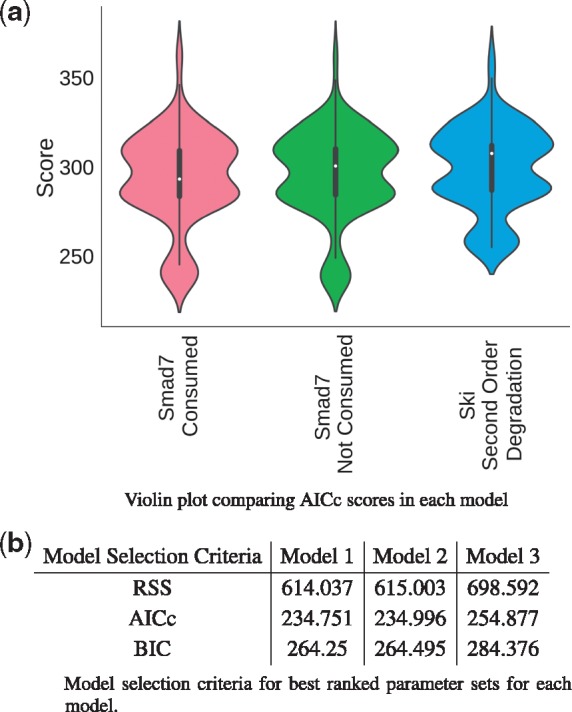
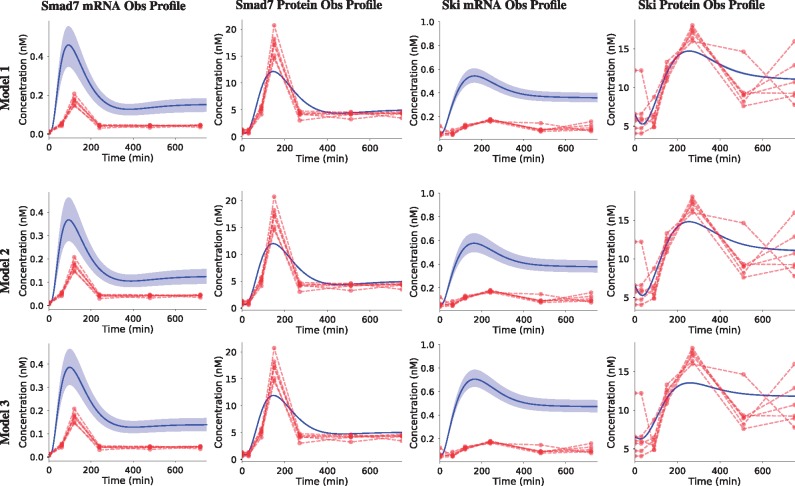
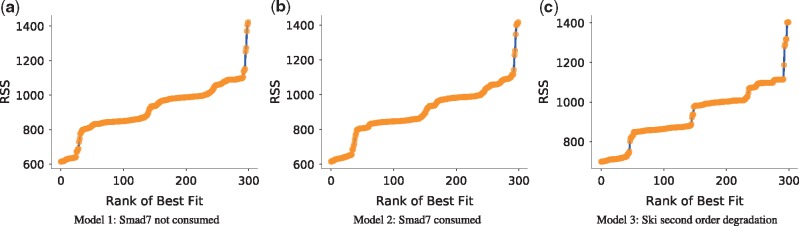
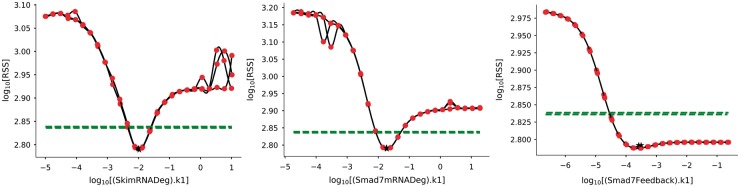
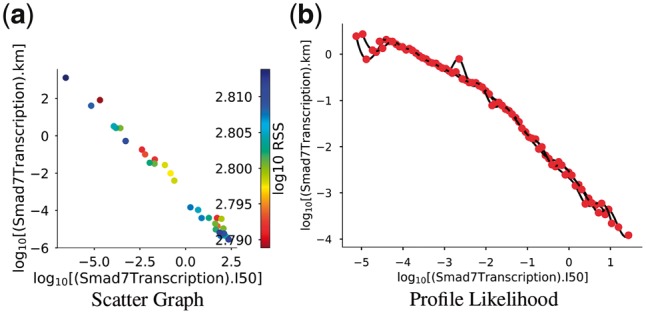
Results: PyCoTools is a Python package aimed at providing a high level interface to COPASI tasks with an emphasis on model calibration. PyCoTools enables the construction of COPASI models and the execution of a subset of COPASI tasks including time courses, parameter scans and parameter estimations. Additional 'composite' tasks which use COPASI tasks as building blocks are available for increasing parameter estimation throughput, performing identifiability analysis and performing model selection. PyCoTools supports exploratory data analysis on parameter estimation data to assist with troubleshooting model calibrations. We demonstrate PyCoTools by posing a model selection problem designed to show case PyCoTools within a realistic scenario. The aim of the model selection problem is to test the feasibility of three alternative hypotheses in explaining experimental data derived from neonatal dermal fibroblasts in response to TGF-β over time. PyCoTools is used to critically analyze the parameter estimations and propose strategies for model improvement.

Availability and implementation: PyCoTools can be downloaded from the Python Package Index (PyPI) using the command 'pip install pycotools' or directly from GitHub (https://github.com/CiaranWelsh/pycotools). Documentation at http://pycotools.readthedocs.io.

Supplementary information: Supplementary data are available at Bioinformatics online.


Figures

Fig. 1.
Fig. 1.
Network representation of ODE networks used in model selection problem. (a) The Zi and Klipp (2007) model is a common component of each model variant. (b) Simulation output from the Zi and Klipp (2007). (c–e) The model variable ‘Smads_Complex_n’ is responsible for transcription reactions in model variants while ‘LRC_Cave’ is degraded by Smad7 protein, thus completing the explicit representation of the Smad7 negative feedback loop. In (c) Model 1, Smad7 participates in but is not consumed by the reaction with LRC_Cave while in (d) Model 2, Smad7 is consumed by this process. In (e) Model 3, the same topology as Model 2 is assumed but it also incorporates second order mass action degradation kinetics for Ski protein
Fig. 2.
Fig. 2.
Experimental data used for model calibration. Neonatal human dermal fibroblasts were treated with 5 ng ml–1 TGF-β for 0, 1, 2, 4, 8 and 12 h. Shown are profiles of 6 biological replicates for (a) Smad7 and (b) Ski messenger RNA, measured by high throughput quantitative PCR as described in the methods
Fig. 3.
Fig. 3.
Model selection criteria. (a) Distribution of Akaike information criteria (AICc) per model displayed as violin plot. The central white dot represents the median; the thin centre line is the 95% confidence interval; the thick central bar is the interquartile range and the width represents the frequency with which a score was observed. These graphs were produced with ‘viz.ModelSelection’. (b) A comparison of model selection criteria for the best ranking parameter sets in each model
Fig. 4.
Fig. 4.
Ensemble time courses produced with ‘viz.PlotTimeCourseEnsemble’. The top 10 best parameter sets for each model were sequentially inserted into their respective models. Time courses were simulated with each parameter set and averaged. Red profiles indicate experimental data while solid blue lines are simulated profiles. Shaded areas represent 95% confidence intervals
Fig. 5.
Fig. 5.
A ‘likelihood-ranks’ plot. The residual sum of squares objective function value is plotted against the rank of best fit for each parameter estimation iteration for each model (a–c). Graphs were produced with ‘viz.LikelihoodRanks’
Fig. 6.
Fig. 6.
Profile likelihoods were calculated using the ‘tasks.ProfileLikelihood’ class for the top three parameter sets of Model 2 and visualized using ‘viz.PlotProfileLikelihood’. The black stars indicate the best estimated parameter. The dotted green line indicates the 95% confidence level and the red spots are the minimum RSS value achieved after re-optimization of all parameters except the parameter of interest (x-axis). Lines between red spots have been interpolated using a cubic spline
Fig. 7.
Fig. 7.
Identification of a log-linear relationship between ‘(Smad7Transcription).km’ and ‘(Smad7Transcription).I50’ (km and I50, respectively). (a) Scatter graph showing that as km increases, I50 decreases (r2 = 0.995, P-value = 1e39). (b) The path traced by km is plotted as a function of I50 during the profile likelihood calculation. Graphs were produced using ‘viz.Scatters’ and ‘viz.PlotProfileLikelihood’ respectively

References

    1. Adamson A. et al. (2016) Signal transduction controls heterogeneous nf-[kappa] b dynamics and target gene expression through cytokine-specific refractory states. Nat. Commun., 7, 12057.. - PMC - PubMed
    1. Akiyoshi S. et al. (1999) c-ski acts as a transcriptional co-repressor in transforming growth factor-β signaling through interaction with smads. J. Biol. Chem., 274, 35269–35277. - PubMed
    1. Ashall L. et al. (2009) Pulsatile stimulation determines timing and specificity of nf-κb-dependent transcription. Science, 324, 242–246. - PMC - PubMed
    1. Balsa-Canto E., Banga J.R. (2011) Amigo, a toolbox for advanced model identification in systems biology using global optimization. Bioinformatics, 27, 2311–2313. - PMC - PubMed
    1. Choi K. et al. (2016) Tellurium: a python based modeling and reproducibility platform for systems biology. bioRxiv, 054601.

Publication types