. 2018 Jun 20;46(11):5366-5380.
doi: 10.1093/nar/gky397.

Identifying and avoiding off-target effects of RNase H-dependent antisense oligonucleotides in mice

Affiliations

Identifying and avoiding off-target effects of RNase H-dependent antisense oligonucleotides in mice

Peter H Hagedorn et al. Nucleic Acids Res. .

Abstract

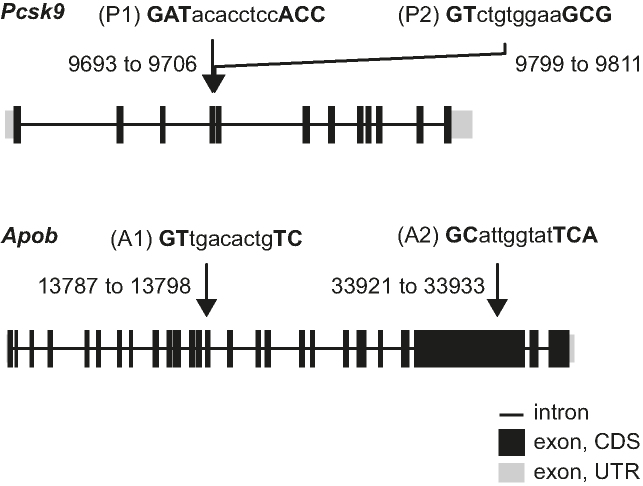
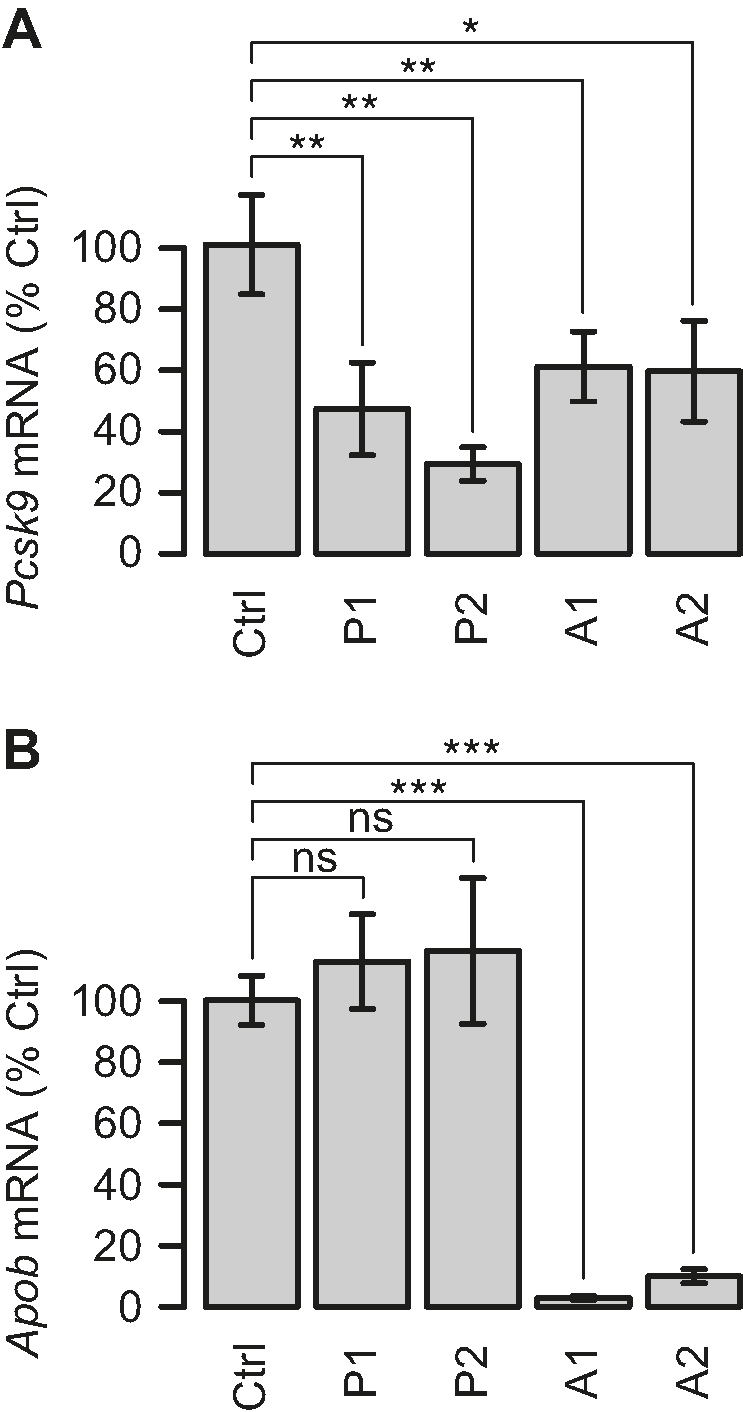
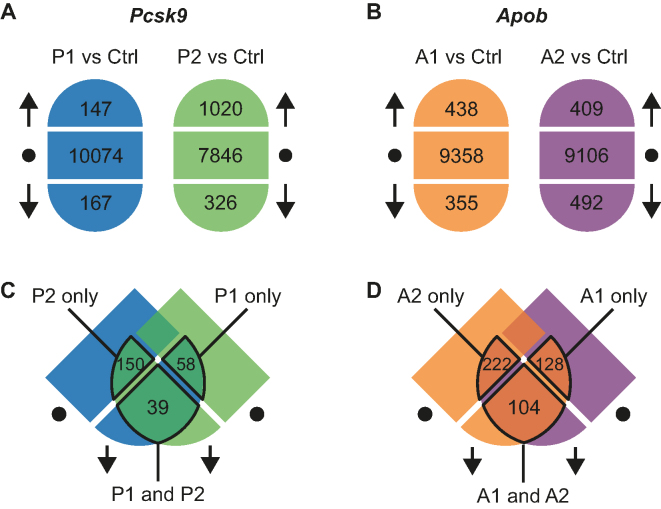
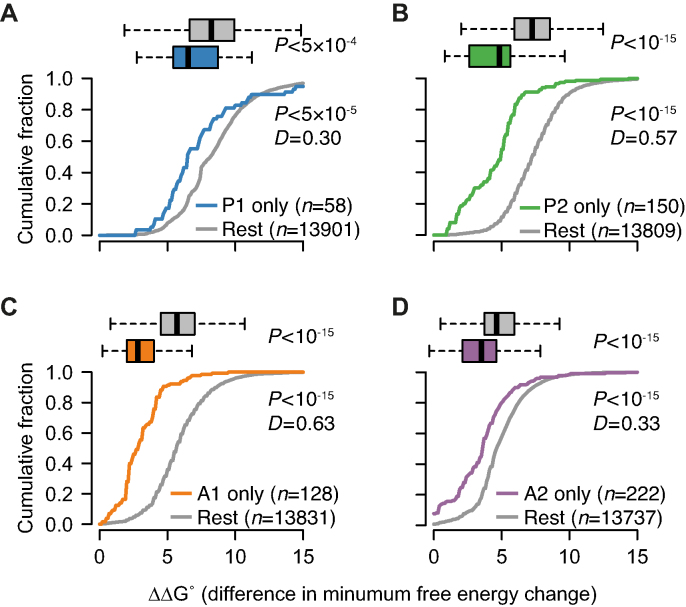
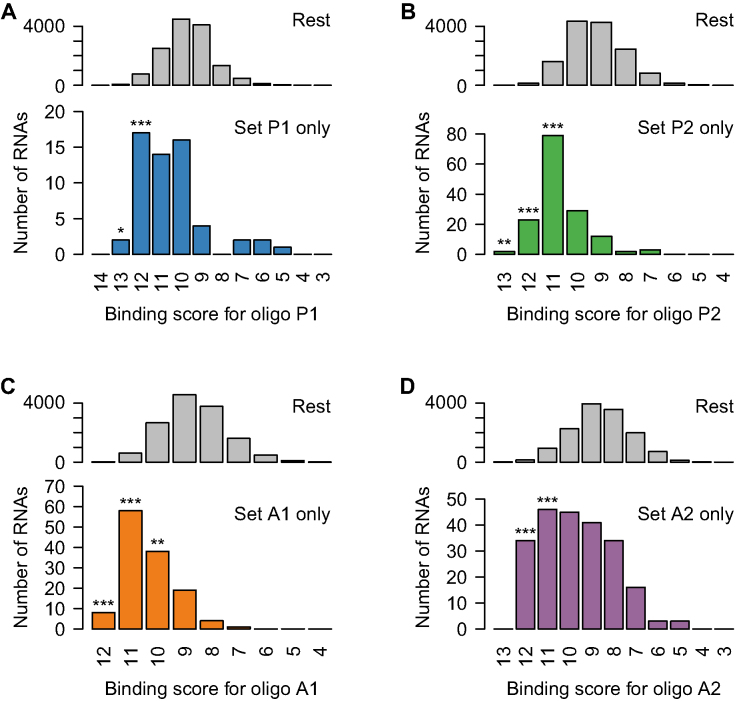
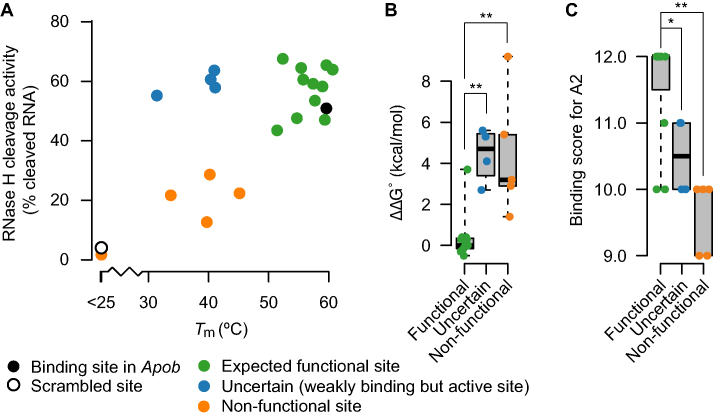
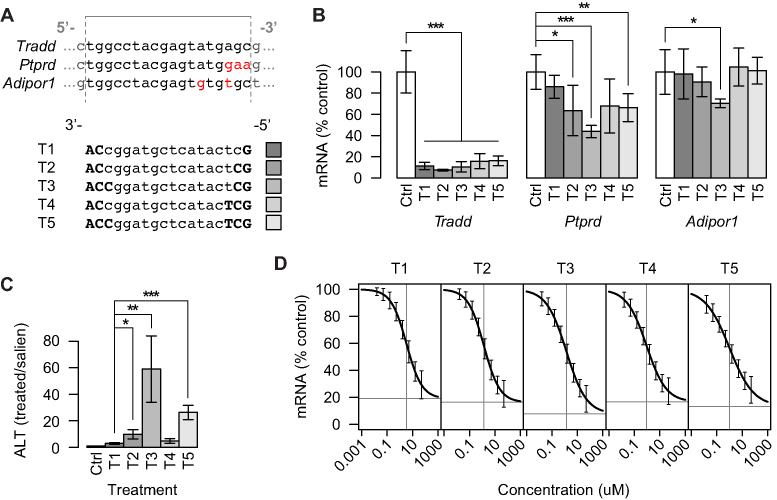
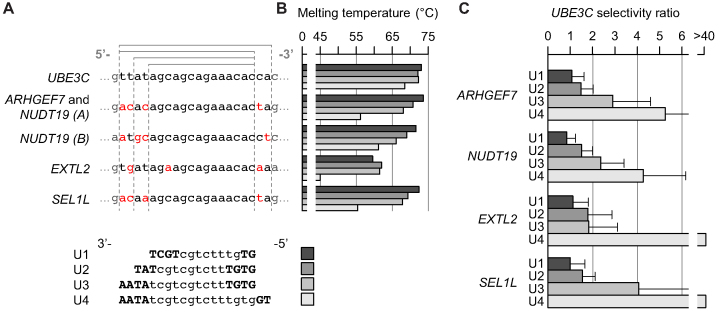
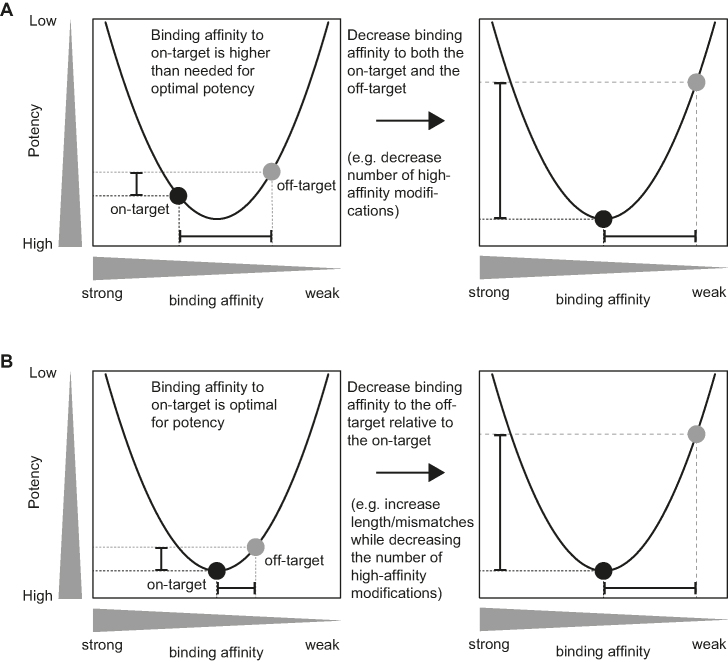
Antisense oligonucleotides that are dependent on RNase H for cleavage and subsequent degradation of complementary RNA are being developed as therapeutics. Besides the intended RNA target, such oligonucleotides may also cause degradation of unintended RNA off-targets by binding to partially complementary target sites. Here, we characterized the global effects on the mouse liver transcriptome of four oligonucleotides designed as gapmers, two targeting Apob and two targeting Pcsk9, all in different regions on their respective intended targets. This study design allowed separation of intended- and off-target effects on the transcriptome for each gapmer. Next, we used sequence analysis to identify possible partially complementary binding sites among the potential off-targets, and validated these by measurements of melting temperature and RNase H-cleavage rates. Generally, our observations were as expected in that fewer mismatches or bulges in the gapmer/transcript duplexes resulted in a higher chance of those duplexes being effective substrates for RNase H. Follow-up experiments in mice and cells show, that off-target effects can be mitigated by ensuring that gapmers have minimal sequence complementarity to any RNA besides the intended target, and that they do not have exaggerated binding affinity to the intended target.


Figures

Figure 1.
Figure 1.
Overview of gapmer designs and intended targets. Gene structures of mouse Pcsk9 with arrows indicating binding regions for gapmers P1 and P2, and of mouse Apob targeted by gapmers A1 and A2. Positions are relative to the transcription start site. For each gapmer sequence, uppercase bold indicates LNA and lower case indicates DNA.
Figure 2.
Figure 2.
Confirmation of gapmer activity on intended targets. Knockdown of (A) Pcsk9 mRNA and (B) Apob mRNA in mouse liver as measured by qRT-PCR following three 10 mg/kg doses on consecutive days of gapmers P1 and P2 (targeted to Pcsk9), or 10 and 5 mg/kg, respectively, of A1 and A2 (targeted to Apob). Data represent the average ± one standard deviation relative to saline-treated controls (Ctrl) with n = 5 per treatment group. Significance of differences in average transcript levels between groups evaluated by Student's t-test. *P < 0.05, **P < 0.01, ***P < 0.001, ns: not significant.
Figure 3.
Figure 3.
Overview of gapmer treatment effects on the transcriptome (A) Transcripts are divided into those significantly increased (up arrow), decreased (down arrow), or not affected (dot) after treatment with P1 (blue) or P2 (green). Similarly, for (B) significantly increased (up arrow), lowered (down arrow) or not affected (dot) transcript levels after treatment with A1 (orange) or A2 (purple) are shown. (C) The three overlapping sets of transcripts that are focused on in this analysis are outlined: those reduced by treatment with P1 but not affected by treatment with P2 (P1 only), those reduced by treatment with P2 but not affected by treatment with P1 (P2 only) and those significantly reduced by both P1 and P2. Similarly for (D) the overlapping sets of transcripts reduced by either A1 only, A2 only or by both A1 and A2.
Figure 4.
Figure 4.
Characterization of partially complementary off-target binding sites by calculation of free energy of binding. For each of the gapmers (A) P1, (B) P2, (C) A1 and (D) A2, transcripts were grouped into those specifically reduced by that gapmer (Figure 3C and D) and the rest, and the distribution of differences in free energy changes displayed as boxplots and cumulative fractions. Significance of differences between groups of transcripts were evaluated by Wilcoxon Rank Sum test for boxplots, and the Kolmogorov–Smirnov test for cumulative fractions. The test statisticD is the maximum vertical deviation between two cumulative fraction curves.
Figure 5.
Figure 5.
Characterization of partially complementary off-target binding sites by sequence score. For each of the gapmers (A) P1, (B) P2, (C) A1 and (D) A2, transcripts were grouped into those specifically reduced by that gapmer (Figure 3C and D) and the rest, and the distributions of binding scores displayed as histograms. Significance of differences between transcripts specifically reduced by a gapmer, and the rest of the transcripts, were evaluated for each binding score by Fisher’s Exact test. *P < 0.05, **P < 0.01, ***P < 0.001.
Figure 6.
Figure 6.
Experimental characterization of potential off-target binding sites. (A) For the gapmer A2, Tm and average RNase H-cleavage activity (n = 3) toward the expected binding region sequence in 23 potential off-targets are shown. Sequences are divided into three groups based on their Tms and cleavage activities. Sequences represented by green dots had characteristics similar to the perfectly complementary Apob binding site (black dot). Sequences represented by blue dots had lower Tms, and sequences represented by orange dots had both lower Tm and lower cleavage activity, similar to the scrambled control characteristics (open dot). For the three groups of binding region sequences, differences in (B) ΔΔG values and (C) binding scores were evaluated by Wilcoxon rank sum test. *P < 0.05, **P < 0.01.
Figure 7.
Figure 7.
Evaluation of gapmer activity on intended and unintended targets for five gapmers with the same target regions but different binding affinities. (A) Expected binding regions in Tradd (intended target) and two unintended targets Ptprd and Adipor1. Mismatched bases in the five gapmers T1–T5 are indicated in red. Gray lines indicate gapmer binding region. For gapmer sequences, uppercase bold indicates LNA and lowercase indicates DNA. (B) Knockdown of the intended target, Tradd mRNA and two unintended targets, Ptprd and Adipor1 mRNA, in mouse liver following five 15 mg/kg doses of gapmers T1–T5 over 2 weeks as measured by qRT-PCR. (C) Levels of ALT in mouse serum following five 15 mg/kg doses of gapmers T1–T5 over 2 weeks. Data represent the average ± one standard deviation relative to saline-treated controls (Ctrl) with n = 5 per treatment group. Significance of differences in average transcript levels between groups were evaluated by Student’s t-test. *P < 0.05, ***P < 0.001. (D) Knockdown of Tradd mRNA at eight different concentrations in mouse primary hepatocytes for each of the gapmers T1–T5. CRCs found by least squares fitting of the four-parameter logistic function. Error bars indicate model-based standard errors (n = 4). Horizontal and vertical gray lines indicate estimated maximal efficacy and EC50, respectively.
Figure 8.
Figure 8.
Evaluation of binding affinity and potency selectivity ratios for four gapmers of different length but the same core target region. (A) Expected binding regions in UBE3C (intended target) and four unintended targets. Mismatched bases in the four gapmers U1–U4 are indicated in red. Gray lines indicate nested gapmer binding regions. For gapmer sequences, uppercase bold indicates LNA and lowercase indicates DNA. (B) Tms for gapmers U1–U4 binding to UBE3C and each of the unintended targets. (C) For each of the unintended targets, the EC50 for each gapmer relative to the EC50 for UBE3C was estimated from an 8-point CRC measured by qRT-PCR (n = 2). Error bars represent one standard deviation as determined from the nonlinear regression using error propagation.
Figure 9.
Figure 9.
Affinity-potency relations suggesting how sequence-specificity can be optimized. Either (A) decrease binding affinity by reducing the number of high-affinity modifications, or (B) increase gapmer length and thereby, the number of mismatches to off-targets. For both suggestions, the extent of the optimization must be balanced against maintaining activity on the intended target.

References

    1. Stein H., Hausen P.. Enzyme from calf thymus degrading the RNA moiety of DNA-RNA Hybrids: Effect on DNA-Dependent RNA polymerase. Science. 1969; 166:393–395. - PubMed
    1. Lima W.F., De Hoyos C.L., Liang X.-H., Crooke S.T.. RNA cleavage products generated by antisense oligonucleotides and siRNAs are processed by the RNA surveillance machinery. Nucleic Acids Res. 2016; 44:3351–3363. - PMC - PubMed
    1. Zamecnik P.C., Stephenson M.L.. Inhibition of Rous sarcoma virus replication and cell transformation by a specific oligodeoxynucleotide. PNAS. 1978; 75:280–284. - PMC - PubMed
    1. Raal F.J., Santos R.D., Blom D.J., Marais A.D., Charng M.-J., Cromwell W.C., Lachmann R.H., Gaudet D., Tan J.L., Chasan-Taber S. et al. . Mipomersen, an apolipoprotein B synthesis inhibitor, for lowering of LDL cholesterol concentrations in patients with homozygous familial hypercholesterolaemia: a randomised, double-blind, placebo-controlled trial. Lancet. 2010; 375:998–1006. - PubMed
    1. Bennett C.F., Swayze E.E.. RNA targeting therapeutics: molecular mechanisms of antisense oligonucleotides as a therapeutic platform. Annu. Rev. Pharmacol. Toxicol. 2010; 50:259–293. - PubMed

Publication types