. 2018 Sep 1;27(17):2965-2977.
doi: 10.1093/hmg/ddy198.

Peripheral blood gene expression reveals an inflammatory transcriptomic signature in Friedreich's ataxia patients

Affiliations

Peripheral blood gene expression reveals an inflammatory transcriptomic signature in Friedreich's ataxia patients

Daniel Nachun et al. Hum Mol Genet. .

Abstract

Transcriptional changes in Friedreich's ataxia (FRDA), a rare and debilitating recessive Mendelian neurodegenerative disorder, have been studied in affected but inaccessible tissues-such as dorsal root ganglia, sensory neurons and cerebellum-in animal models or small patient series. However, transcriptional changes induced by FRDA in peripheral blood, a readily accessible tissue, have not been characterized in a large sample. We used differential expression, association with disability stage, network analysis and enrichment analysis to characterize the peripheral blood transcriptome and identify genes that were differentially expressed in FRDA patients (n = 418) compared with both heterozygous expansion carriers (n = 228) and controls (n = 93 739 individuals in total), or were associated with disease progression, resulting in a disease signature for FRDA. We identified a transcriptional signature strongly enriched for an inflammatory innate immune response. Future studies should seek to further characterize the role of peripheral inflammation in FRDA pathology and determine its relevance to overall disease progression.


Figures

Figure 1.
Figure 1.
Differential expression analysis identifies 829 genes DE between patients and controls and 1078 genes DE between patients and carriers. Volcano plot of all genes in patient versus control and patient versus carrier comparisons. The fold change is on the x-axis, and the log BF is on the y-axis. Blue indicates a gene that is significantly (log BF > 0.5, pp > 0.95) downregulated, while red indicates a gene that is significantly upregulated.
Figure 2.
Figure 2.
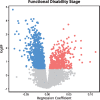
Regression of gene expression with FDS identifies 1508 transcripts significantly associated with FDS. Volcano plot of all genes in FDS regression. The regression coefficient is on the x-axis, and the log BF is on the y-axis. Blue indicates a gene with a significant (log BF > 0.5) negative regression coefficient, while red indicates a gene with a significant positive coefficient.
Figure 3.
Figure 3.
Enrichment analysis identifies biological pathways that are significantly overrepresented in DE and FDS-associated genes. Bar plot of most representative enrichment term for each gene set on the y-axis. The label on the right is the pathway, and the number in parentheses is the size of the overlap between the gene set and pathway. The log BF is on the x-axis, and is statistically significant at log BF > 0.5 (marked by red line).
Figure 4.
Figure 4.
Overlap of DE genes with other datasets. The number in the top of each cell in the heatmap is the number of transcripts in the overlap and the number in parentheses is the log BF of a hypergeometric overlap test. Log BF > 0.5 is considered significant. T3 = 12 weeks old, T4 = 16 weeks old, T5 = 20 weeks old. See Supplementary Material for additional descriptions of the datasets and analytic procedures.
Figure 5.
Figure 5.
WGCNA identifies the pink, green and black modules as significantly different across clinical status. (A) Cluster dendrogram and color assignment for all transcripts in the full dataset. (B) Cluster dendrogram and heatmap of eigengene correlations. (C) Violin plots showing eigengene posterior estimates for the pink, green and black modules. The 95% credible intervals are between the smaller top and bottom lines and median estimate is the larger middle line.
Figure 6.
Figure 6.
WGCNA identifies the magenta, yellow and red modules as significantly associated with FDS (A) Cluster dendrogram and color assignment for all transcripts in the patients with FDS available. (B) Cluster dendrogram and heatmap of eigengene correlations. (C) Scatterplots showing relationship of FDS (on the x-axis) with eigengene expression (on the y-axis) for the magenta, yellow, and red modules.
Figure 7.
Figure 7.
Enrichment analysis identifies biological pathways that are significantly overrepresented in WGCNA modules. Bar plot of most representative enrichment term for each gene set is on the y-axis. The label on the right is the pathway, and the number in parentheses is the size of the overlap between the gene set and pathway. The log BF on the x-axis, and is statistically significant at log BF > 0.5.
Figure 8.
Figure 8.
Cell type deconvolution analysis. Boxplots showing cell type proportion of seven cell types in patients, carriers and controls.
Figure 9.
Figure 9.
qPCR and array validation of top three DE genes in 32 patients and 32 age- and sex-matched controls. Boxplots showing the relative expression of the top three DE genes to the median value of the control samples. A total of 21 patient and 16 control samples (marked with closed circles) were new and not previously included in the analysis. Top: microarray data, bottom: qPCR.

References

    1. Cossée M., Puccio H., Gansmuller A., Koutnikova H., Dierich A., LeMeur M.. et al. (2000) Inactivation of the Friedreich ataxia mouse gene leads to early embryonic lethality without iron accumulation. Hum. Mol. Genet., 9, 1219–1226. - PubMed
    1. Gottesfeld J.M., Rusche J.R., Pandolfo M. (2013) Increasing frataxin gene expression with histone deacetylase inhibitors as a therapeutic approach for Friedreich’s ataxia. J. Neurochem., 126, 147–154. - PMC - PubMed
    1. Pastore A., Puccio H. (2013) Frataxin: a protein in search for a function. J. Neurochem., 126, 43–52. - PubMed
    1. Cnop M., Mulder H., Igoillo-Esteve M. (2013) Diabetes in Friedreich ataxia. J. Neurochem., 126, 94–102. - PubMed
    1. Campuzano V., Montermini L., Molto M.D., Pianese L., Cossee M., Cavalcanti F., Monros E., Rodius F., Duclos F., Monticelli A.. et al. (1996) Triplet repeat expansion Friedreich’s ataxia: autosomal recessive disease caused by an intronic GAA triplet repeat expansion. Science, 271, 1423–1427. - PubMed

Publication types