

Nitrogen limitation, toxin synthesis potential, and toxicity of cyanobacterial populations in Lake Okeechobee and the St. Lucie River Estuary, Florida, during the 2016 state of emergency event
- PMID: 29791446
- PMCID: PMC5965861
- DOI: 10.1371/journal.pone.0196278
Nitrogen limitation, toxin synthesis potential, and toxicity of cyanobacterial populations in Lake Okeechobee and the St. Lucie River Estuary, Florida, during the 2016 state of emergency event
Abstract
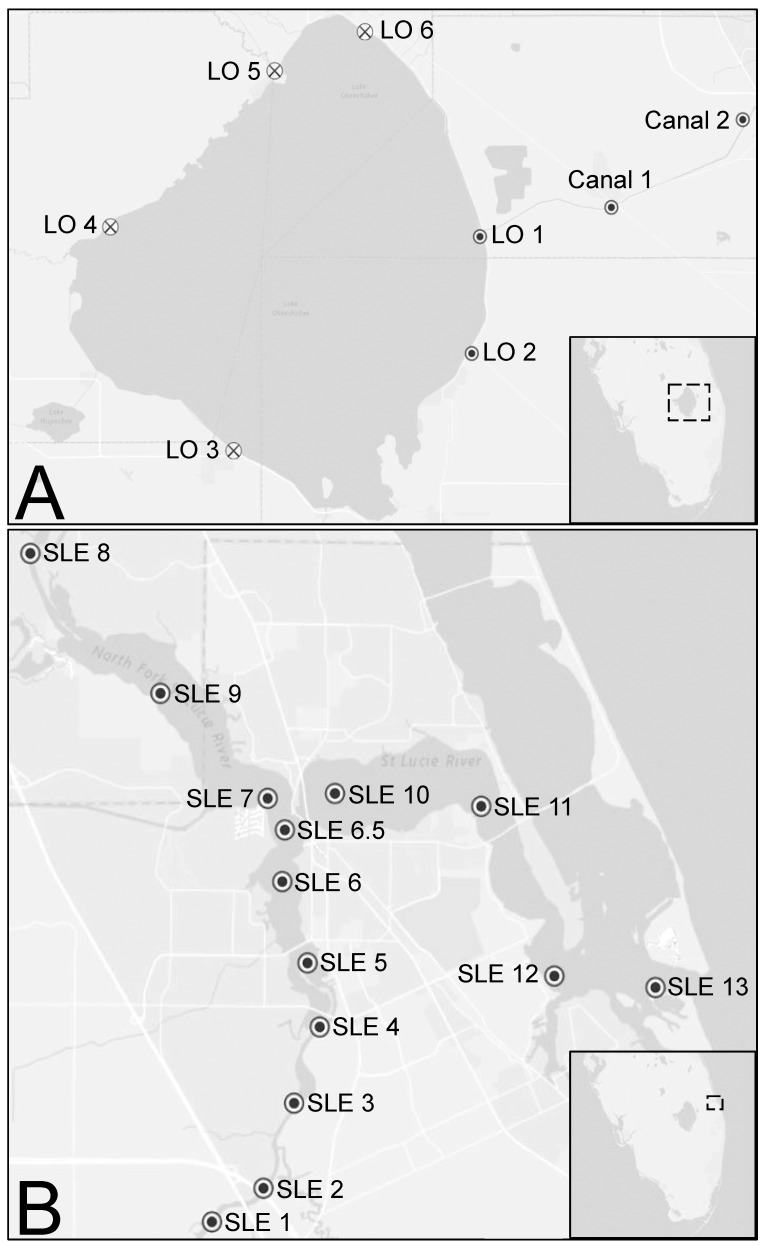
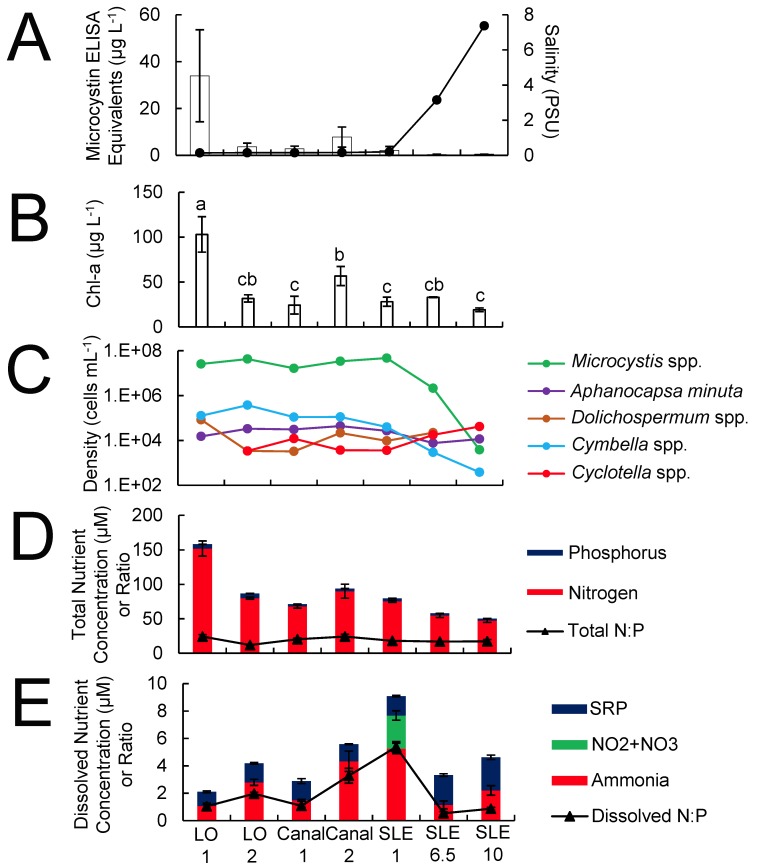
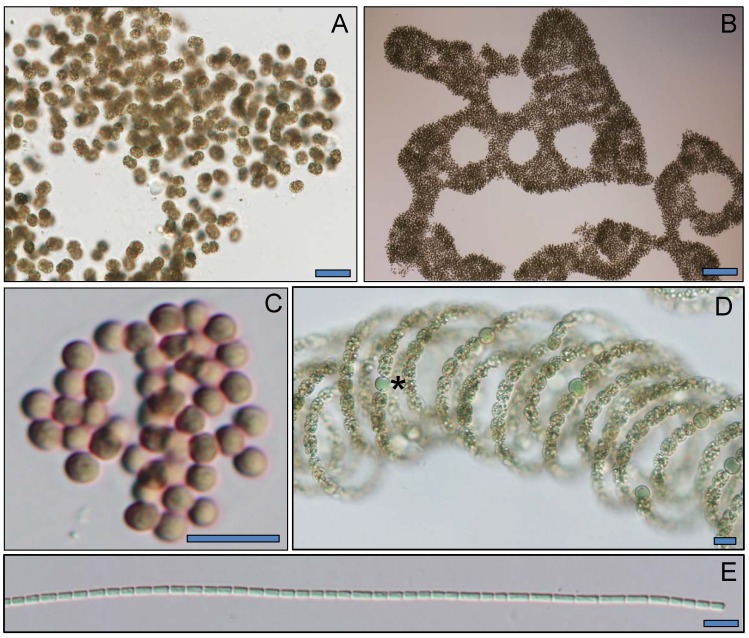
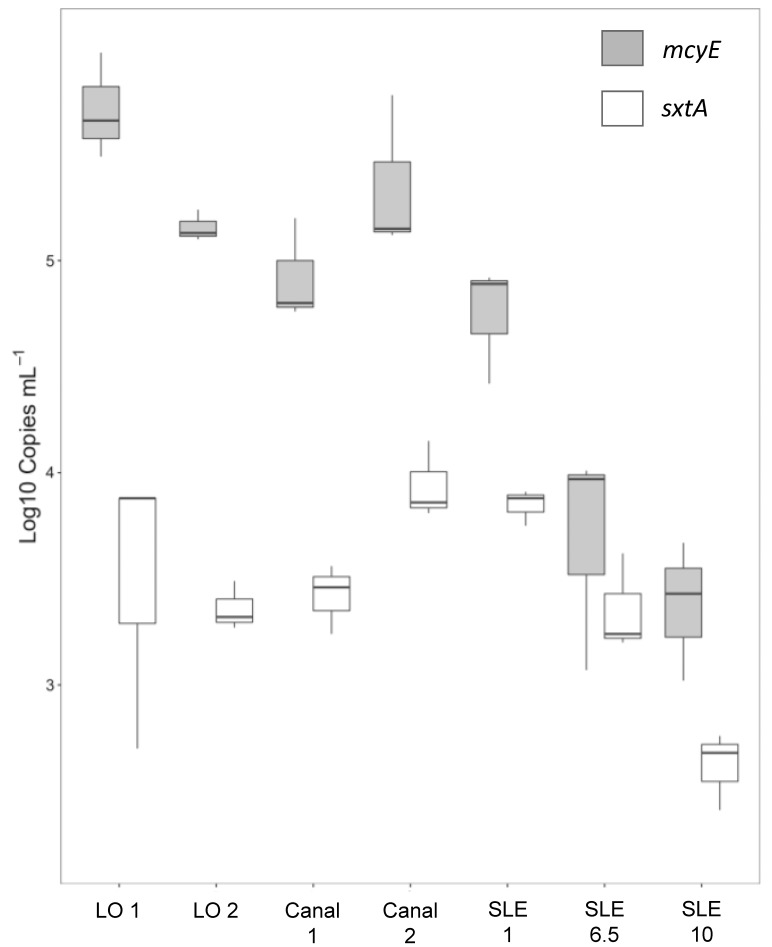
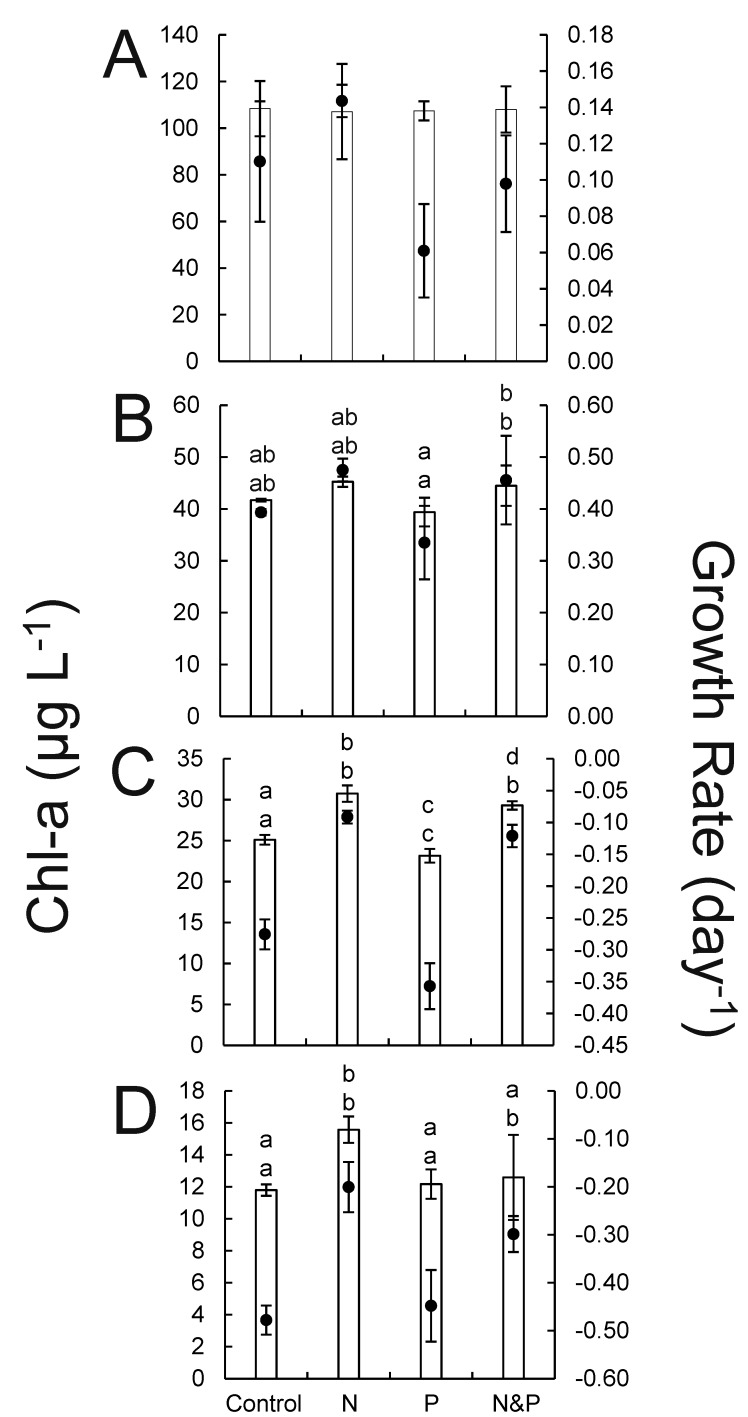
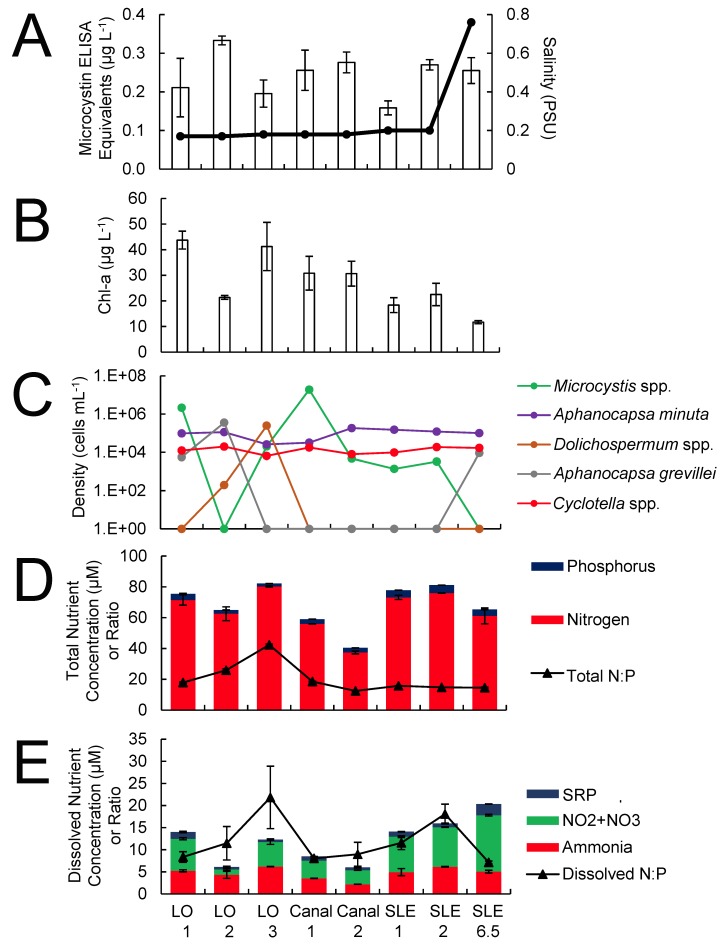
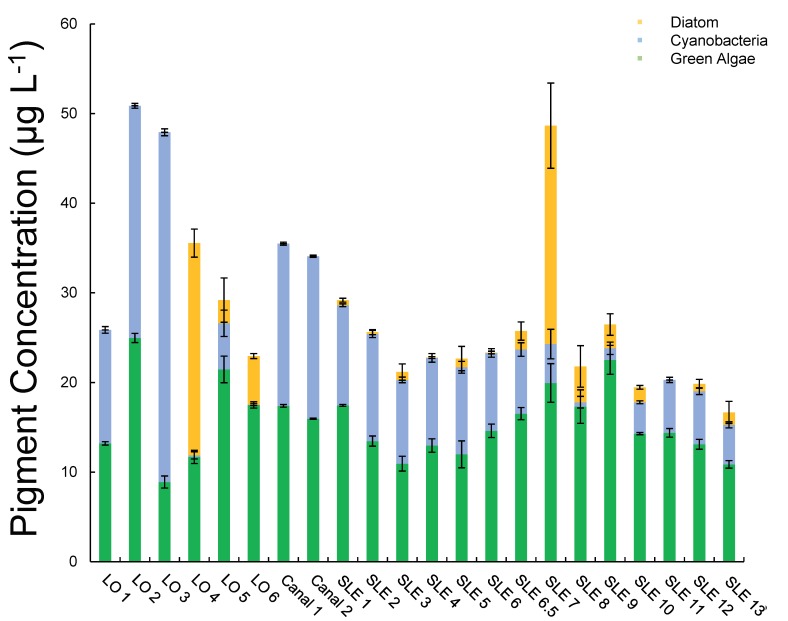
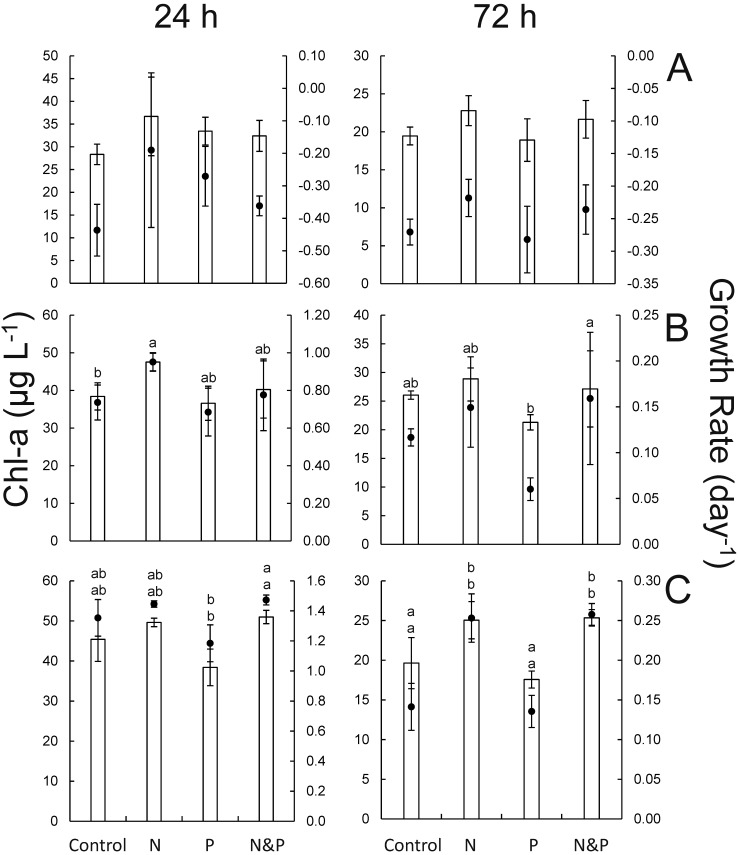
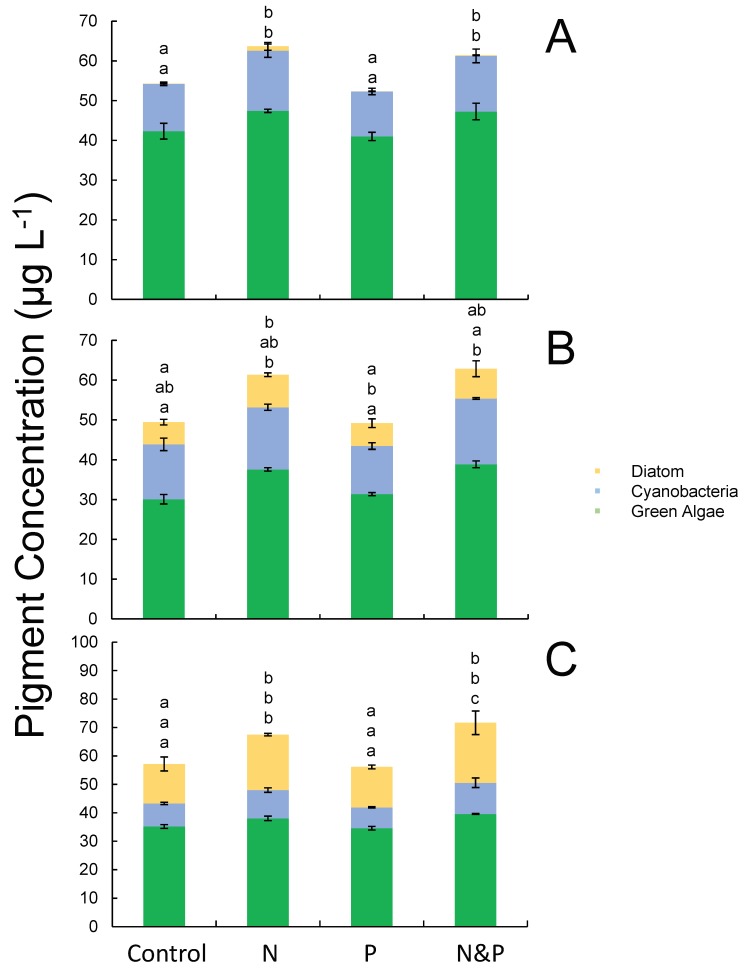
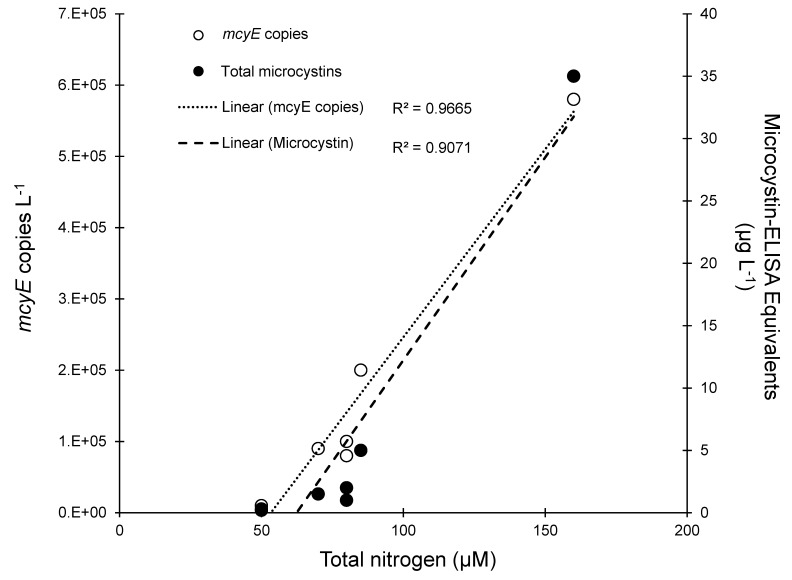
Lake Okeechobee, FL, USA, has been subjected to intensifying cyanobacterial blooms that can spread to the adjacent St. Lucie River and Estuary via natural and anthropogenically-induced flooding events. In July 2016, a large, toxic cyanobacterial bloom occurred in Lake Okeechobee and throughout the St. Lucie River and Estuary, leading Florida to declare a state of emergency. This study reports on measurements and nutrient amendment experiments performed in this freshwater-estuarine ecosystem (salinity 0-25 PSU) during and after the bloom. In July, all sites along the bloom exhibited dissolved inorganic nitrogen-to-phosphorus ratios < 6, while Microcystis dominated (> 95%) phytoplankton inventories from the lake to the central part of the estuary. Chlorophyll a and microcystin concentrations peaked (100 and 34 μg L-1, respectively) within Lake Okeechobee and decreased eastwards. Metagenomic analyses indicated that genes associated with the production of microcystin (mcyE) and the algal neurotoxin saxitoxin (sxtA) originated from Microcystis and multiple diazotrophic genera, respectively. There were highly significant correlations between levels of total nitrogen, microcystin, and microcystin synthesis gene abundance across all surveyed sites (p < 0.001), suggesting high levels of nitrogen supported the production of microcystin during this event. Consistent with this, experiments performed with low salinity water from the St. Lucie River during the event indicated that algal biomass was nitrogen-limited. In the fall, densities of Microcystis and concentrations of microcystin were significantly lower, green algae co-dominated with cyanobacteria, and multiple algal groups displayed nitrogen-limitation. These results indicate that monitoring and regulatory strategies in Lake Okeechobee and the St. Lucie River and Estuary should consider managing loads of nitrogen to control future algal and microcystin-producing cyanobacterial blooms.
Conflict of interest statement
The authors have declared that no competing interests exist.
Figures
Similar articles
-
Nutrient availability in a freshwater-to-marine continuum: Cyanobacterial blooms along the Lake Okeechobee Waterway.Harmful Algae. 2024 Nov;139:102710. doi: 10.1016/j.hal.2024.102710. Epub 2024 Aug 25. Harmful Algae. 2024. PMID: 39567062
-
Septic systems contribute to nutrient pollution and harmful algal blooms in the St. Lucie Estuary, Southeast Florida, USA.Harmful Algae. 2017 Dec;70:1-22. doi: 10.1016/j.hal.2017.09.005. Epub 2017 Oct 26. Harmful Algae. 2017. PMID: 29169565
-
Toxin composition of the 2016 Microcystis aeruginosa bloom in the St. Lucie Estuary, Florida.Toxicon. 2017 Nov;138:169-172. doi: 10.1016/j.toxicon.2017.09.005. Epub 2017 Sep 9. Toxicon. 2017. PMID: 28899665
-
The dual role of nitrogen supply in controlling the growth and toxicity of cyanobacterial blooms.Harmful Algae. 2016 Apr;54:87-97. doi: 10.1016/j.hal.2016.01.010. Harmful Algae. 2016. PMID: 28073483 Review.
-
Duelling 'CyanoHABs': unravelling the environmental drivers controlling dominance and succession among diazotrophic and non-N2 -fixing harmful cyanobacteria.Environ Microbiol. 2016 Feb;18(2):316-24. doi: 10.1111/1462-2920.13035. Epub 2015 Oct 14. Environ Microbiol. 2016. PMID: 26310611 Review.
Cited by
-
Microbial community structure and functional properties in permanently and seasonally flooded areas in Poyang Lake.Sci Rep. 2020 Mar 16;10(1):4819. doi: 10.1038/s41598-020-61569-z. Sci Rep. 2020. PMID: 32179796 Free PMC article.
-
Complete Genome Sequence of Microcystis aeruginosa FD4, Isolated from a Subtropical River in Southwest Florida.Microbiol Resour Announc. 2020 Sep 17;9(38):e00813-20. doi: 10.1128/MRA.00813-20. Microbiol Resour Announc. 2020. PMID: 32943567 Free PMC article.
-
Perceptions of environmental problems and solutions in Florida across sectors: A survey of key stakeholders and the public.Ambio. 2023 Jun;52(6):1098-1111. doi: 10.1007/s13280-023-01829-0. Epub 2023 Feb 23. Ambio. 2023. PMID: 36820961 Free PMC article.
-
A Multiplex Analysis of Potentially Toxic Cyanobacteria in Lake Winnipeg during the 2013 Bloom Season.Toxins (Basel). 2019 Oct 11;11(10):587. doi: 10.3390/toxins11100587. Toxins (Basel). 2019. PMID: 31614508 Free PMC article.
-
Contaminant Exposure and Liver and Kidney Lesions in North American River Otters in the Indian River Lagoon, Florida.Toxics. 2024 Sep 21;12(9):684. doi: 10.3390/toxics12090684. Toxics. 2024. PMID: 39330612 Free PMC article.
References
-
- Carey C, Ibelings B, Hoffmann E, Hamilton D, Brookes J. Eco-physiological adaptations that favour freshwater cyanobacteria in a changing climate. Water Res. 2012;46(5):1394–1407. doi: 10.1016/j.watres.2011.12.016 - DOI - PubMed
-
- O’Neil J, Davis T, Burford M, Gobler C. The rise of harmful cyanobacteria blooms: The potential roles of eutrophication and climate change. Harmful Algae. 2012;14:313–334.
-
- Paerl H, Paul V. Climate change: links to global expansion of harmful cyanobacteria. Water Res. 2012;46(5):1349–1363. doi: 10.1016/j.watres.2011.08.002 - DOI - PubMed
-
- Jeppesen E, Søndergaard M, Meerhoff M, Lauridsen T, Jensen J. Shallow lake restoration by nutrient loading reduction—some recent findings and challenges ahead. Hydrobiologia. 2007;584(1):239–252.
Publication types
MeSH terms
Substances
LinkOut - more resources
Full Text Sources
Other Literature Sources
