

Ultra-short-term heart rate variability during resistance exercise in the elderly
- PMID: 29791599
- PMCID: PMC6002140
- DOI: 10.1590/1414-431x20186962
Ultra-short-term heart rate variability during resistance exercise in the elderly
Abstract
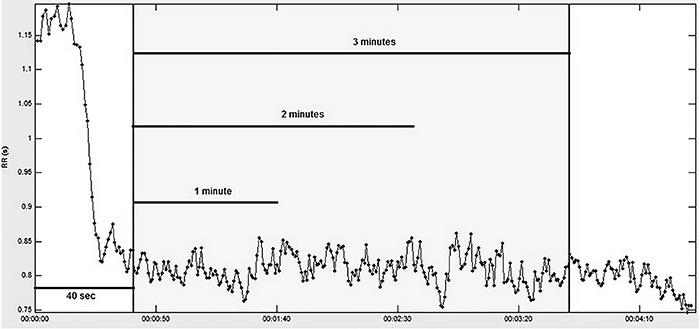
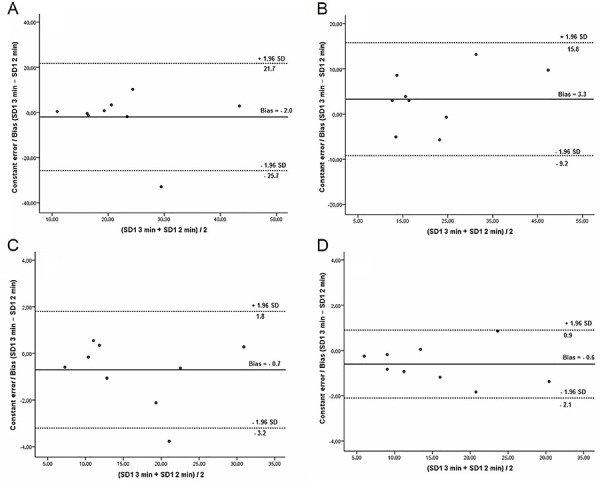
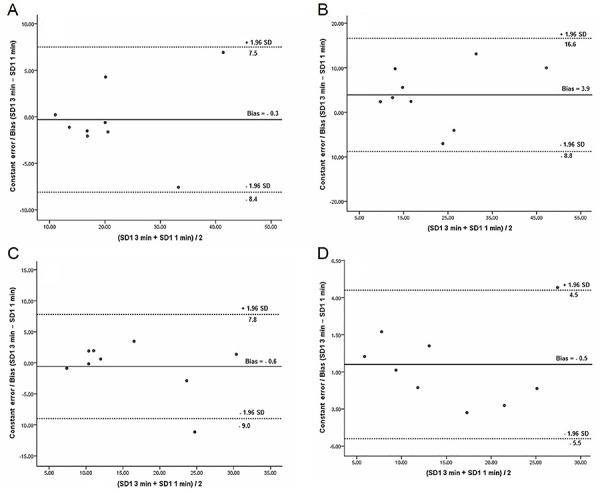
Despite the appeal of ultra-short-term heart rate variability (HRV) methods of analysis applied in the clinical and research settings, the number of studies that have investigated HRV by analyzing R-R interval (RRi) recordings shorter than 5 min is still limited. Moreover, ultra-short-term HRV analysis has not been extensively validated during exercise and, currently, no indications exist for its applicability during resistance exercise. The aim of the present study was to compare ultra-short-term HRV analysis with standard short-term HRV analysis during low-intensity, dynamic, lower limb resistance exercise in healthy elderly subjects. Heart rate (HR) and RRi signals were collected from 9 healthy elderly men during discontinuous incremental resistance exercise consisting of 4-min intervals at low intensities (10, 20, 30, and 35% of 1-repetition maximum). The original RRi signals were segmented into 1-, 2-, and 3-min sections. HRV was analyzed in the time domain (root mean square of the of differences between adjacent RRi, divided by the number of RRi, minus one [RMSSD]), RRi mean value and standard deviation [SDNN] (percentage of differences between adjacent NN intervals that are greater than 50 ms [pNN50]), and by non-linear analysis (short-term RRi standard deviation [SD1] and long-term RRi standard deviation [SD2]). No significant difference was found at any exercise intensity between the results of ultra-short-term HRV analysis and the results of standard short-term HRV analysis. Furthermore, we observed excellent (0.70 to 0.89) to near-perfect (0.90 to 1.00) concordance between linear and non-linear parameters calculated over 1- and 2-min signal sections and parameters calculated over 3-min signal sections. Ultra-short-term HRV analysis appears to be a reliable surrogate of standard short-term HRV analysis during resistance exercise in healthy elderly subjects.
Figures


References
-
- De Bruyne MC, Kors JA, Hoes AW, Klootwijk P, Dekker JM, Hofman A, et al. Both decreased and increased heart rate variability on the standard 10-s electrocardiogram predict cardiac mortality in the elderly The Rotterdam Study. Am Heart J. 1999;150:1282–1288. doi: 10.1093/oxfordjournals.aje.a009959. - DOI - PubMed
-
- Dekker JM, Schouten EG, Klootwijk P, Pool J, Swenne CA, Kromhout D. Heart rate variability from short electrocardiographic recordings predicts mortality from all causes in middle-aged and elderly men. The Zutphen Study. Am J Epidemiol. 1997;145:899–908. doi: 10.1093/oxfordjournals.aje.a009049. - DOI - PubMed
Publication types
MeSH terms
LinkOut - more resources
Full Text Sources
Other Literature Sources
