Practical considerations for transitioning early childhood interventions to scale: lessons from the Saving Brains portfolio
- PMID: 29791735
- PMCID: PMC9764263
- DOI: 10.1111/nyas.13684
Practical considerations for transitioning early childhood interventions to scale: lessons from the Saving Brains portfolio
Abstract
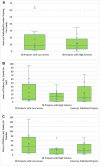
Small pilot studies of young children have frequently shown promise, but very few have been successfully scaled to the regional or national levels. How can we ensure that these promising approaches move from a suite of pilots to full-scale implementation that can deliver sustainable impact for hundreds of millions of children? To elucidate concrete lessons learned and suggestions on accelerating the transition to impact at scale, we reviewed the Saving Brains portfolio to better understand three points: (1) the extent to which useful signals of impact could be extracted from data at the seed phase, (2) the ways in which innovators (project leaders) were approaching human resource challenges critical for scaling, and (3) the multisector diversity of the portfolio and the way innovators entered partnerships. The findings suggest key considerations for transitioning early childhood development interventions to scale and sustainability: strong entrepreneurial leadership, rigorous measurement and active use of data in support of adaptive learning, and champions acting at subnational levels. Together, these can enable flexible, iterative learning that can make the scaling process an opportunity to increase the level of benefit each child receives from an intervention.
Keywords: early childhood development; implementation research; international development; program evaluation; scaling up social innovation.
© 2018 The Authors. Annals of the New York Academy of Sciences published by Wiley Periodicals, Inc. on behalf of The New York Academy of Sciences.
Figures


References
-
- Every Woman Every Child . 2015. The global strategy for women's children's and adolescents' health (2016–2030). New York: Every Woman Every Child.
-
- Aboud, F.E. & Yousafzai A.K.. 2015. Global health and development in early childhood. Annu. Rev. Psychol. 66: 433–457. - PubMed
-
- Baker‐Henningham, H. & Lopez Boo F.. 2010. Early childhood stimulation interventions in developing countries: a comprehensive literature review. The Institute for the Study of Labor, Bonn.
-
- Britto, P.R. , Lye S.J., Proulx K., et al. 2017. Nurturing care: promoting early childhood development. Lancet 389: 91–102. - PubMed
Publication types
MeSH terms
LinkOut - more resources
Full Text Sources
Other Literature Sources
Medical

