. 2018 May 22;23(8):2495-2508.
doi: 10.1016/j.celrep.2018.04.059.

A Multi-layered Quantitative In Vivo Expression Atlas of the Podocyte Unravels Kidney Disease Candidate Genes

Affiliations

A Multi-layered Quantitative In Vivo Expression Atlas of the Podocyte Unravels Kidney Disease Candidate Genes

Markus M Rinschen et al. Cell Rep. .

Abstract

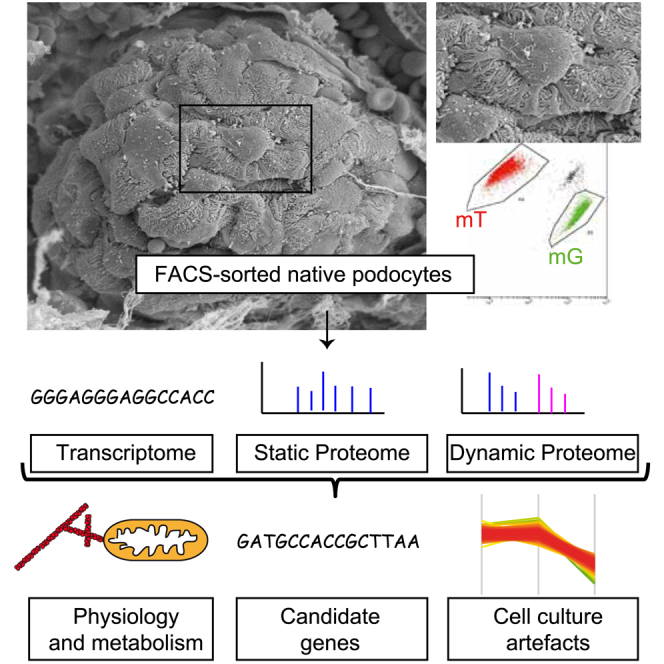
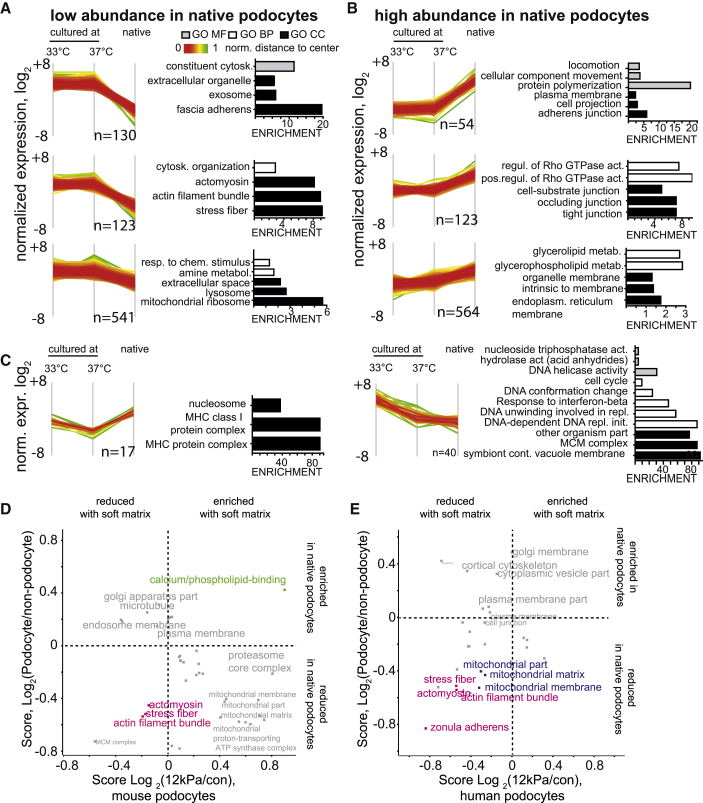
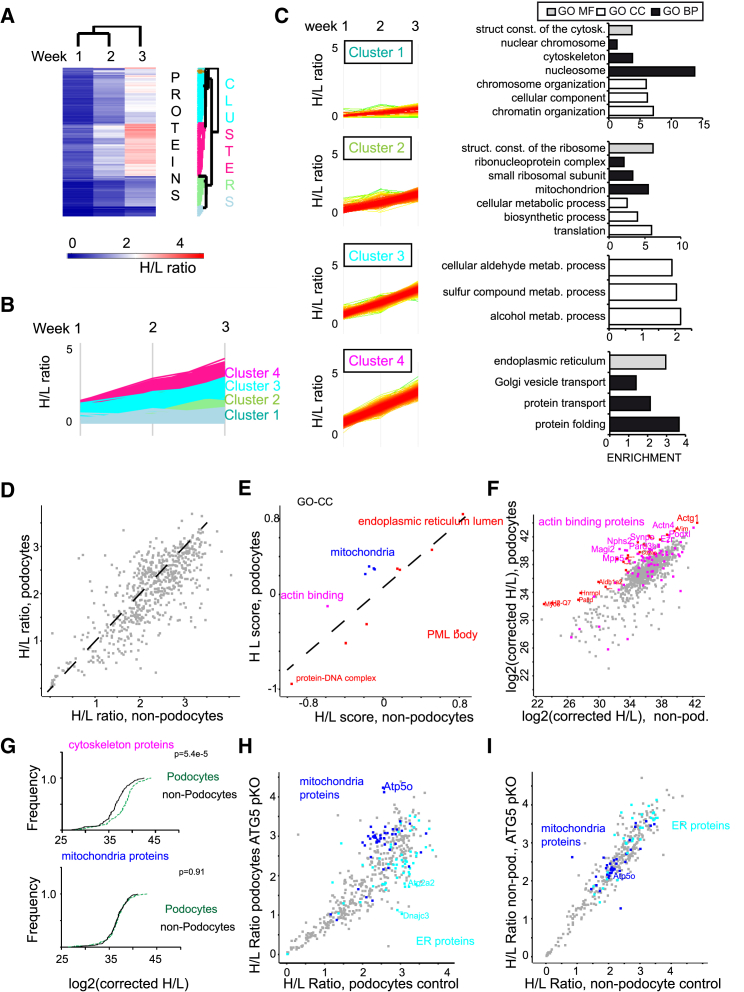
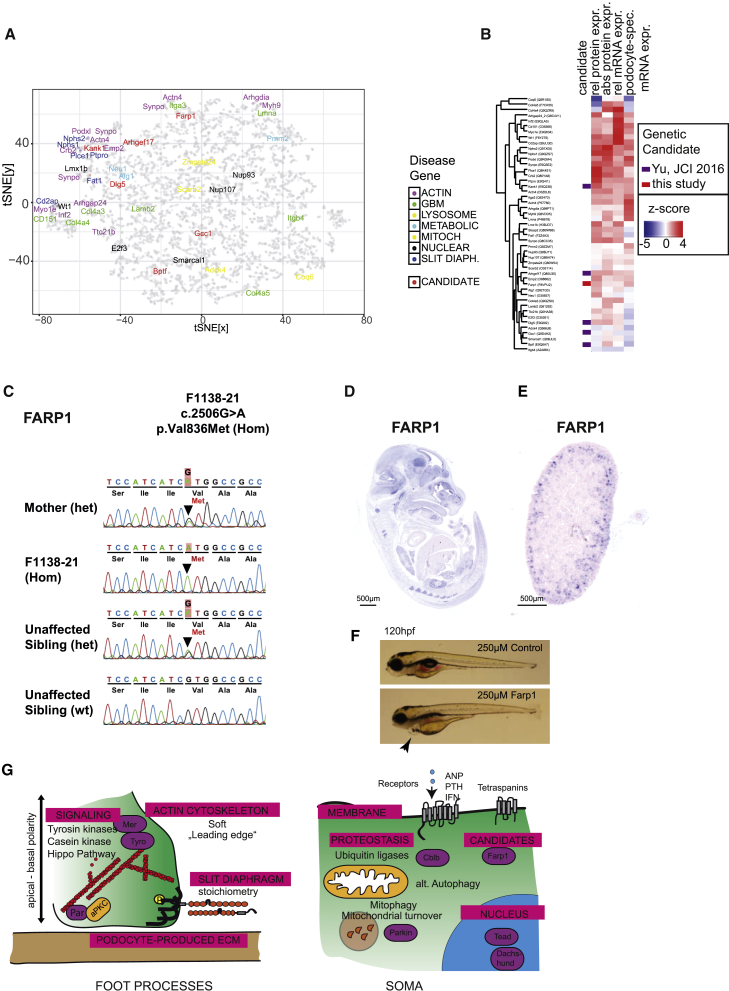
Damage to and loss of glomerular podocytes has been identified as the culprit lesion in progressive kidney diseases. Here, we combine mass spectrometry-based proteomics with mRNA sequencing, bioinformatics, and hypothesis-driven studies to provide a comprehensive and quantitative map of mammalian podocytes that identifies unanticipated signaling pathways. Comparison of the in vivo datasets with proteomics data from podocyte cell cultures showed a limited value of available cell culture models. Moreover, in vivo stable isotope labeling by amino acids uncovered surprisingly rapid synthesis of mitochondrial proteins under steady-state conditions that was perturbed under autophagy-deficient, disease-susceptible conditions. Integration of acquired omics dimensions suggested FARP1 as a candidate essential for podocyte function, which could be substantiated by genetic analysis in humans and knockdown experiments in zebrafish. This work exemplifies how the integration of multi-omics datasets can identify a framework of cell-type-specific features relevant for organ health and disease.

Keywords: end-stage renal disease; focal segmental glomerulosclerosis; hereditary nephrotic syndrome; kinase; metabolism; proteinuria; proteostasis; pulse SILAC; slit diaphragm; systems biology.


Figures

None
Graphical abstract
Figure 1
Figure 1
Absolute Quantification of the Native Podocyte Proteome (A) Panther term analysis of expressed genes and absolute copy numbers (intensity-based absolute quantification [iBAQ]). iBAQ values corresponding to the number of protein copies (green) and the number of different proteins (black) are plotted. (B) Overview of the dynamic range of the podocyte proteome absolutely quantified using iBAQ. (C) Expression of proteins encoded by genes causing hereditary nephrotic syndrome and focal segmental glomerulosclerosis in podocytes according to Bierzynska et al. 2015). (D) Abundance of the 10 most abundant proteins. (E) Application of the proteomic ruler to detect protein copy numbers of transmembrane proteins of the slit diaphragm complex (Wiśniewski et al., 2014). Calculated numbers of protein copies per cell are depicted.
Figure 2
Figure 2
Integration of Deep Transcriptomic and Proteomics Data (A) Comparison of this and other recent transcriptomic (tpm) studies using mRNA-seq. All datasets were processed with the same bioinformatics pipeline as indicated in the Experimental Procedures. (B) Reactome analysis of transcripts enriched in podocytes (up) and de-enriched in podocytes (down). (C) Scatterplot demonstrating correlation between proteomic (iBAQ) and (tpm) copy numbers in podocytes (Pearson’s R = 0.47, log(p) = 14.8). The density of individual proteins is color-coded (blue, high density; green, low density). (D) 2D Uniprot keyword analysis of podocyte transcript and protein copy numbers identifies significantly changed Uniprot keywords with an especially high increase in either omic dataset (permutation-based FDR < 0.05). The dashed gray line (y = x) indicates annotations equally represented in both omic datasets. (E) Distribution of individual Uniprot keyword members in the original scatterplot (analog to C).
Figure 3
Figure 3
Determination of Podocyte-Enriched Proteins Uncovers Druggable Targets and Candidate Genes for Podocyte Function (A) Volcano plot of protein quantification of podocytes over non-podocytes. The logarithmic fold change of label-free quantification intensities (LFQs) is plotted versus the negative decadic logarithm of the p value. 551 proteins pass the criteria for significant podocyte enrichment (significance analysis of microarrays [SAM] analysis, s0 = 1, FDR = 0.01). (B) Enrichment analysis of protein domains in podocytes. Protein domains (PFAM and INTERPO annotation) were tested for enrichment within the podocyte-enriched proteins over the proteins not significantly enriched. –log(p value) of every significantly enriched protein domain is plotted against fold enrichment. Fisher’s exact test, FDR < 0.02. (C) GO terms overrepresented in the 551 podocyte-enriched proteins compared with non-podocyte specific proteins. Fold enrichment of GO terms representing molecular function (GOMF, gray bars), cellular component (GOCC, black bars), and biological process (GOBP, white bars). All GO terms are statistically enriched in the dataset compared with non-podocyte proteins. Fishers exact test, FDR < 0.05. (D) Significantly de-enriched GO terms in the 551 podocyte-specific proteins (the same statistical criteria and color code as in C). (E) CLSM micrographs of pericardial nephrocytes at second larval stage. RNAi-mediated knockdown of Tsp26A significantly reduced ANF-RFP (red) uptake, suggesting that Tsp26A is required for pericardial nephrocyte (green) function. The ANF-RFP uptake is significantly reduced by the knockdown of Tsp26A (p value < 0.05) (F) Ultrastructural alteration of Tsp26A knockdown nephrocytes. Arrows indicate nephrocyte cell contacts.
Figure 4
Figure 4
Comparison of the Deep Native (Isolated from Living Mice) and Cultured Podocyte Proteome Enables Functional Analysis of Cell Culture-Induced Proteome Artefacts (A) Protein clusters were defined based on normalized intensities as depicted in Figure S4C–D. Shown are clusters that have a higher intensity in cultured podocytes compared with the native podocyte proteome. Distance to the mean is color-coded in each cluster. GO terms significantly overrepresented in each cluster are depicted (Fishers exact test, p values corrected with FDR < 0.05). (B) Three clusters have a lower intensity (and abundance) in the podocyte proteome compared with the cultured podocyte proteome. GO terms significantly overrepresented in each cluster are depicted. (C) Two clusters have different intensities in undifferentiated and differentiated podocytes. (D) Mouse podocytes were seeded on matrices with 12 kPa, and the proteome was compared with control cell culture dishes. See Figure S5 for details regarding the dataset. The 2D GO enrichment score of fold change on soft matrix (log2 12 kPa/control) cell culture is plotted against the score for podocyte-enrichment (log2(podocyte/non-podocyte)) (Figure 3). The data demonstrate a significant decrease of stress fiber proteins under both conditions (soft versus stiff matrix and native podocyte versus non-podocyte). Significantly changed terms are plotted (FDR < 0.05) (E) Human podocytes were seeded on matrices with 12 kPa, and the proteome was compared with control cell culture dishes. See Figure S5 for details regarding the dataset.
Figure 5
Figure 5
Integration of Podocyte Proteome Dynamics and Deep Proteomics Mapping Demonstrate Proteostatic Podocyte Features (A) Adult mice were fed a diet in which lysine was substituted with stable isotope-labeled 13C6 lysine for the indicated times, resulting in a gradual substitution of the endogenous lysine 12C6 lysine (light lysine) with 13C6 lysine (heavy lysine). Mean H/L ratios of more than 4 animals are depicted. (B) Hierarchical clustering (maximum distance) of mean protein H/L ratios was performed, and four major row clusters were defined. (C) GO enrichment of GOMF (black), GOCC (gray), and GOBP (white) terms (Fishers exact test, corrected FDR < 0.05) in each of the 4 major clusters was performed. (D) Scatterplot of H/L ratios between podocytes and non-podocyte cells demonstrates that podocytes have a generally slower incorporation of stable isotope-labeled lysine. (E) 2D GO enrichment analysis of H/L ratios of significantly regulated Uniprot keywords of podocytes and non-podocyte cells (FDR < 0.05). (F) Scatterplot of corrected H/L ratios between podocytes and non-podocytes. (G) Cumulative histogram of corrected H/L ratios for cytoskeletal and mitochondrial proteins. When H/L ratios are corrected with absolute protein abundance (Dotproduct, see Experimental Procedures for details), mitochondrial proteins have a similar corrected ratio compared with all other proteins. (H) H/L ratios in podocytes from control mice plotted against H/L ratios in podocytes in Nphs2.Cre:Atg5 fl/fl (ATG5ko) mice. ATP5o is a subunit of the mitochondrial ATP synthase. (I) H/L ratios in non-podocytes from control mice plotted against H/L ratios in non-podocytes of (ATG5ko) mice.
Figure 6
Figure 6
Identification of Candidates for Human Nephrotic Syndrome Disease-Causing Genes (A) Clustering analysis (t-SNE) of 6,700 proteins for which absolute protein expression, relative protein expression, mRNA expression, and tissue-specific mRNA expression were available. (B) Heatmap analysis of expression of disease genes and one previously unreported candidate gene, FARP1, as well as five candidates from a previous study (Yu et al., 2016). (C) Sanger sequencing of the respective regions of FARP1 demonstrates segregation of the mutated alleles with the affected status in family F1138 (FARP1). (D and E) Embryonic and renal expression profile of the candidate protein Farp1 by in situ hybridization. (D) Farp1 shows high expression in metanephric glomerular precursors and readily detectable expression in neuronal tissues and, to some extent, in other pulmonary epithelial structures in embryonic day 14.5 (E14.5) mouse embryos. (E) Farp1 expression is maintained in murine P1 kidneys in glomeruli. (F) Knockdown of farp1 in zebrafish induces edema and pericardial effusion (arrow), indicating proteinuria and podocyte dysfunction. (G) Overview of insights into podocyte biology obtained from this study.

Similar articles

Cited by

References

    1. Bartram M.P., Habbig S., Pahmeyer C., Höhne M., Weber L.T., Thiele H., Altmüller J., Kottoor N., Wenzel A., Krueger M. Three-layered proteomic characterization of a novel ACTN4 mutation unravels its pathogenic potential in FSGS. Hum. Mol. Genet. 2016;25:1152–1164. - PubMed
    1. Bierzynska A., Soderquest K., Koziell A. Genes and podocytes - new insights into mechanisms of podocytopathy. Front. Endocrinol. (Lausanne) 2015;5:226. - PMC - PubMed
    1. Bierzynska A., Soderquest K., Dean P., Colby E., Rollason R., Jones C., Inward C.D., McCarthy H.J., Simpson M.A., Lord G.M. MAGI2 Mutations Cause Congenital Nephrotic Syndrome. J. Am. Soc. Nephrol. 2016;28:1614–1621. - PMC - PubMed
    1. Boerries M., Grahammer F., Eiselein S., Buck M., Meyer C., Goedel M., Bechtel W., Zschiedrich S., Pfeifer D., Laloë D. Molecular fingerprinting of the podocyte reveals novel gene and protein regulatory networks. Kidney Int. 2013;83:1052–1064. - PubMed
    1. Boute N., Gribouval O., Roselli S., Benessy F., Lee H., Fuchshuber A., Dahan K., Gubler M.C., Niaudet P., Antignac C. NPHS2, encoding the glomerular protein podocin, is mutated in autosomal recessive steroid-resistant nephrotic syndrome. Nat. Genet. 2000;24:349–354. - PubMed

Publication types