. 2018 May 23;15(1):24.
doi: 10.1186/s12989-018-0261-5.

Cerium dioxide nanoparticles exacerbate house dust mite induced type II airway inflammation

Affiliations

Cerium dioxide nanoparticles exacerbate house dust mite induced type II airway inflammation

Kirsty Meldrum et al. Part Fibre Toxicol. .

Abstract

Background: Nanomaterial inhalation represents a potential hazard for respiratory conditions such as asthma. Cerium dioxide nanoparticles (CeO2NPs) have the ability to modify disease outcome but have not been investigated for their effect on models of asthma and inflammatory lung disease. The aim of this study was to examine the impact of CeO2NPs in a house dust mite (HDM) induced murine model of asthma.

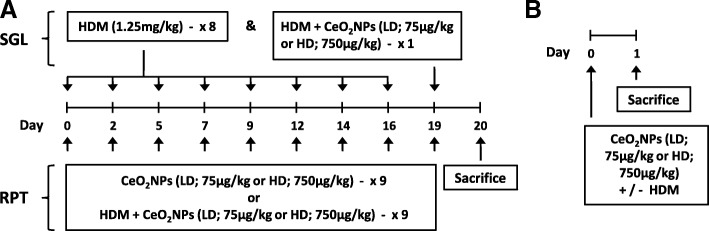
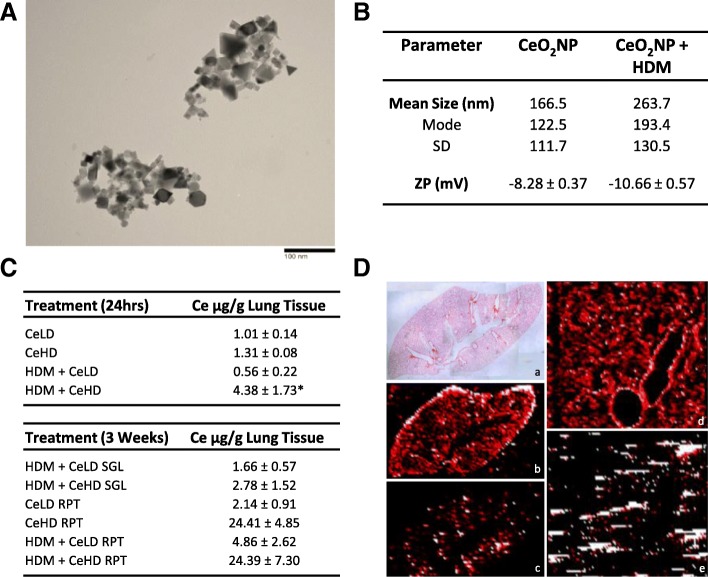
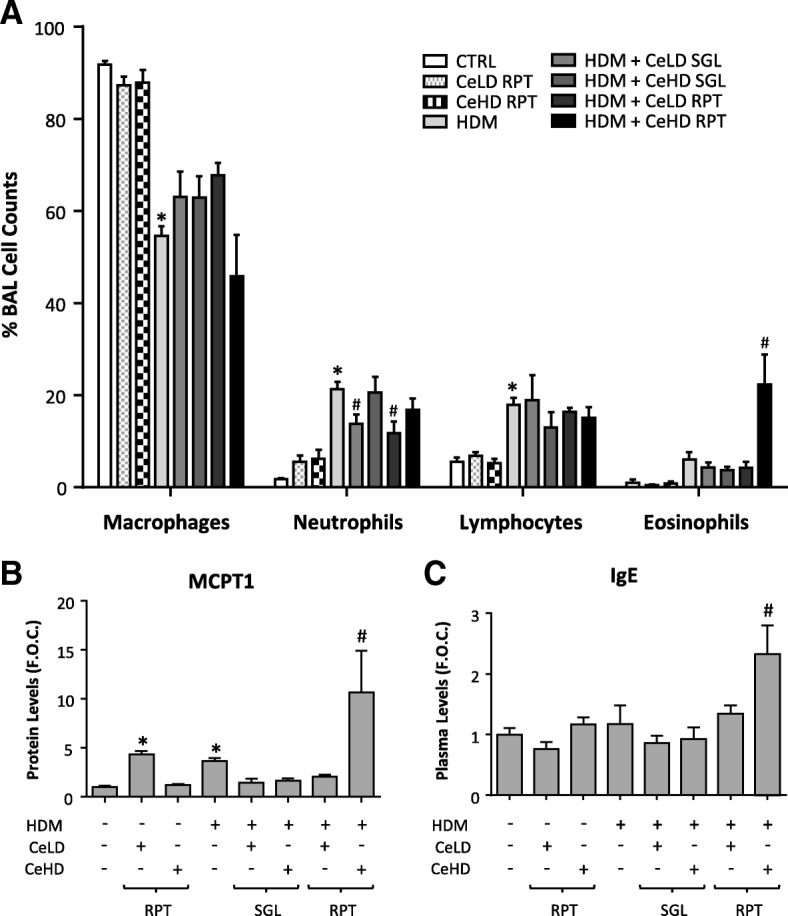
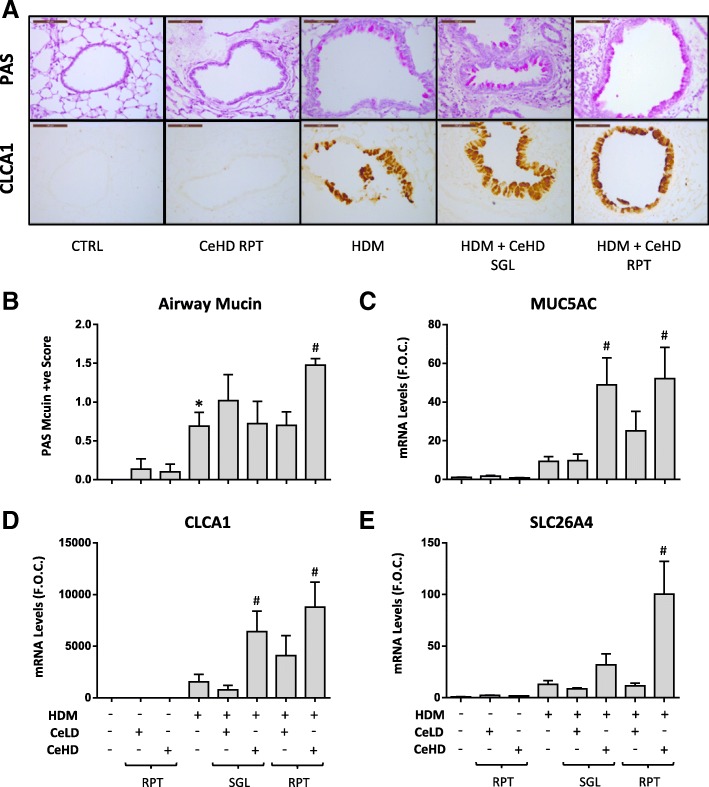
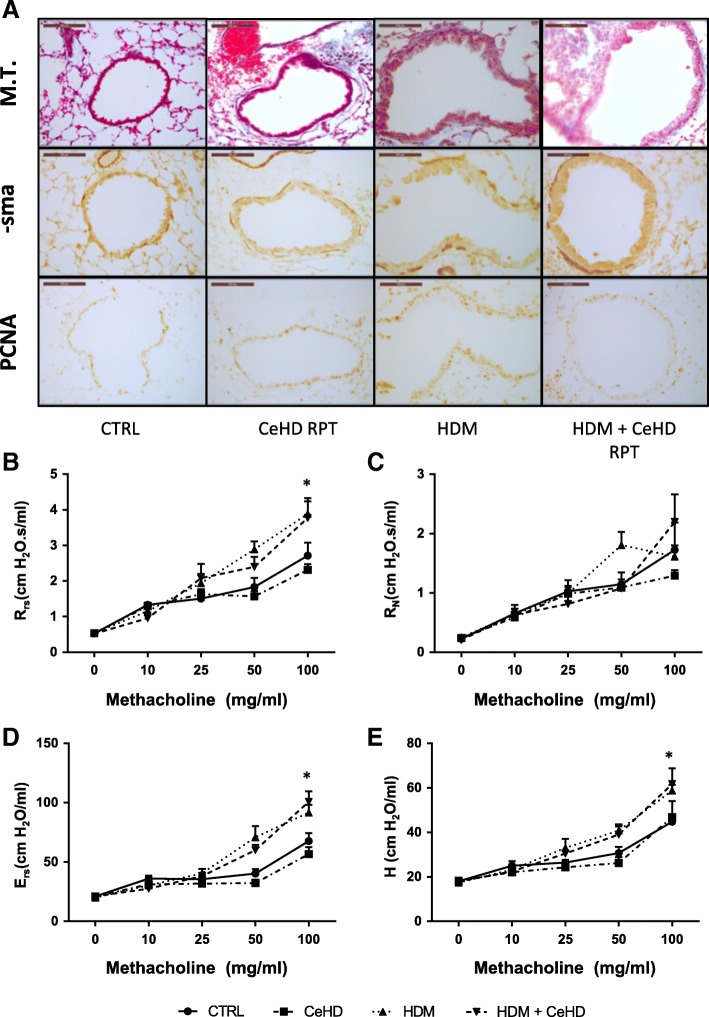
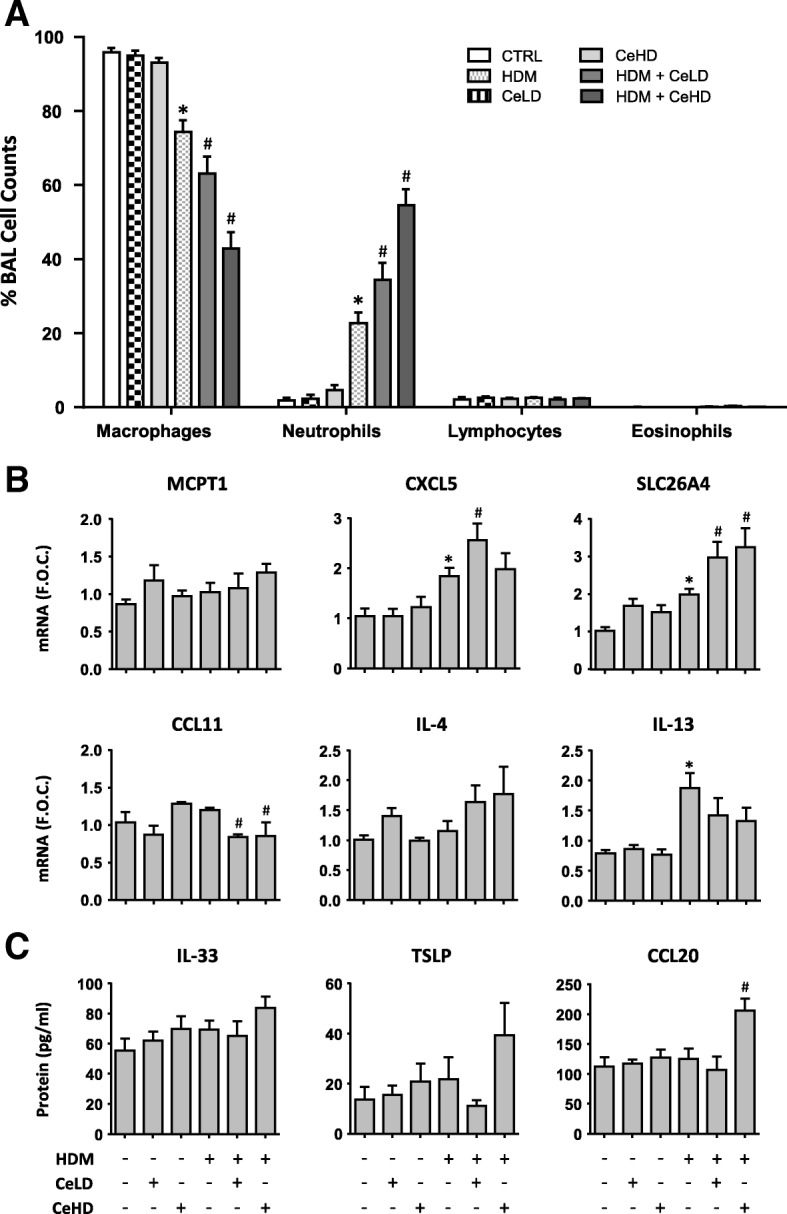
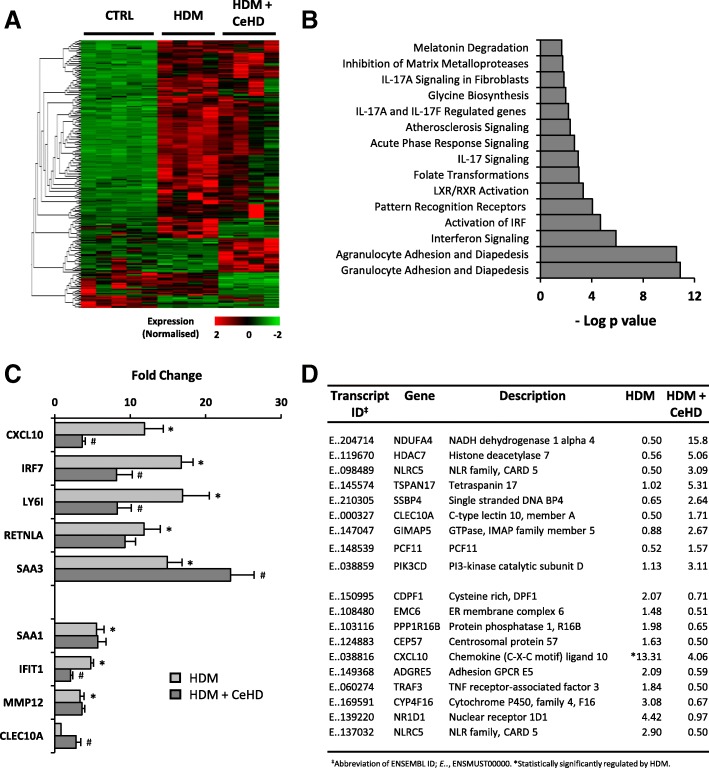
Results: Repeated intranasal instillation of CeO2NPs in the presence of HDM caused the induction of a type II inflammatory response, characterised by increased bronchoalveolar lavage eosinophils, mast cells, total plasma IgE and goblet cell metaplasia. This was accompanied by increases in IL-4, CCL11 and MCPT1 gene expression together with increases in the mucin and inflammatory regulators CLCA1 and SLC26A4. CLCA1 and SLC26A4 were also induced by CeO2NPs + HDM co-exposure in air liquid interface cultures of human primary bronchial epithelial cells. HDM induced airway hyperresponsiveness and airway remodelling in mice were not altered with CeO2NPs co-exposure. Repeated HMD instillations followed by a single exposure to CeO2NPs failed to produce changes in type II inflammatory endpoints but did result in alterations in the neutrophil marker CD177. Treatment of mice with CeO2NPs in the absence of HDM did not have any significant effects. RNA-SEQ was used to explore early effects 24 h after single treatment exposures. Changes in SAA3 expression paralleled increased neutrophil BAL levels, while no changes in eosinophil or lymphocyte levels were observed. HDM resulted in a strong induction of type I interferon and IRF3 dependent gene expression, which was inhibited with CeO2NPs co-exposure. Changes in the expression of genes including CCL20, CXCL10, NLRC5, IRF7 and CLEC10A suggest regulation of dendritic cells, macrophage functionality and IRF3 modulation as key early events in how CeO2NPs may guide pulmonary responses to HDM towards type II inflammation.

Conclusions: CeO2NPs were observed to modulate the murine pulmonary response to house dust mite allergen exposure towards a type II inflammatory environment. As this type of response is present within asthmatic endotypes this finding may have implications for how occupational or incidental exposure to CeO2NPs should be considered for those susceptible to disease.

Keywords: Asthma; Lung; Nanomaterial; Transcriptomics.


Conflict of interest statement

Ethics approval

All procedures were performed in accordance with the Animals (Scientific Procedures) Act 1986 which complies with EU Directive 2010/63/EU, including review and approval by the local Animal Welfare and Ethical Review Body.

Competing interests

The authors declare that they have no competing interests. The authors alone are responsible for the content and writing of the manuscript.

Publisher’s Note

Springer Nature remains neutral with regard to jurisdictional claims in published maps and institutional affiliations.

Figures

Fig. 1
Fig. 1
Experimental protocol for intranasal administration of HDM and nanoparticles. Balb/c mice were exposed through intranasal instillation to cerium dioxide nanoparticles (CeO2NPs), low dose (LD) (75 μg/kg) or high dose (HD) (750 μg/kg), alone or in combination with house dust mite (HDM) (1.25 mg protein/kg). Three week exposure protocols involved 9 individual instillations on the indicated days (a). Specific protocols involved either pre-treatment with HDM for the first 8 instillations followed by a combination of HDM + CeO2NPs (SGL) or 9 repeat treatments of CeO2NPs +/− HDM (RPT) as indicated (a). Mice were also exposed to a single instillation of CeO2NPs (LD and HD) +/− HDM (b). Sacrifice and collection of tissues was carried out on the days indicated (a, b)
Fig. 2
Fig. 2
Nanomaterial characterisation and lung deposition. CeO2NPs were re-suspended in water, drops dried on TEM grids, and primary size and structure visualised using TEM (a). These nanoparticles were also suspended in PBS treatment diluent with and without HDM and agglomerate size was determined using nanoparticle tracking analysis (b) with results expressed as mean, mode and standard deviation (SD) of size distribution. Particle charge was also determined as zeta potential (ZP) by dynamic light scattering and expressed in millivolts (mV) mean values ± standard error of the mean (SEM) (b). Mice were exposed to CeO2NPs at either a low dose (CeLD) (75 μg/kg) or high dose (CeHD) (750 μg/kg) with and without HDM (1.25 mg/kg), instillation protocols as described in Fig. 1. After treatment, lung tissue was removed and digested prior to ICP-MS based quantification of elemental 140Ce content. Results are expressed as μg/g lung tissue mean values ± SEM for between 3 and 6 animals (c). Statistical significance between all treatments was carried out using one way ANOVA with comparison between CeHD and HDM + CeHD represented as (* p < 0.05). Lung tissue from a single exposure to CeHD for 24 h was fixed in 10% formalin and processed for laser ablation ICP-MS detection of 63Cu (b, d) and 140Ce (c, e) tissue distribution (d). The elemental distribution in both whole lung (a,b,c) (× 4 magnification) and airway (d,e) (× 100 magnification) was examined. H&E staining was used to visualise general lung structure (a) (d)
Fig. 3
Fig. 3
Inflammatory responses within the lung after repeat CeO2NPs and HDM exposure. Mice (n = 5–9 per treatment group) were exposed to CeO2NPs at either low dose (CeLD) (75 μg/kg) or high dose (CeHD) (750 μg/kg) with and without HDM (1.25 mg/kg), instillation protocols as described in Fig. 1. After treatment, bronchoalveolar cells were analysed for differential immune cell content. Results are expressed as mean ± SEM % total cells counted (300–500 per animal) (a). Lung homogenate was examined for protein levels of the mast cell marker MCPT1 (b) and total blood plasma Immunoglobulin E levels (c) by ELISA. Results were expressed as mean ± SEM fold over control (F.O.C.) levels. Statistical significance between treatments was carried out by one way ANOVA. Comparisons between particle and HDM treatments alone and control levels are represented as (* p < 0.05), while comparisons between particle + HDM combinations and HDM levels are represented as (# p < 0.05)
Fig. 4
Fig. 4
Inflammatory marker expression within the lung after repeat CeO2NPs and HDM exposure. Mice (n = 6–7 per treatment group) were exposed to CeO2NPs at either low dose (CeLD) (75 μg/kg) or high dose (CeHD) (750 μg/kg) with and without HDM (1.25 mg/kg), according to instillation protocols described in Fig. 1. After treatment, total lung mRNA was isolated and examined for transcript levels of the indicated inflammatory markers by RT-PCR analysis (a). BAL fluid was also examined for protein levels of inflammatory cytokines by ELISA (b). Results were expressed as mean ± SEM fold over control (F.O.C.) levels. Statistical significance between treatments was assessed using one way ANOVA. Comparisons between particle and HDM treatments alone and control levels are represented as (* p < 0.05), while comparisons between particle + HDM combinations and HDM levels are represented as (# p < 0.05)
Fig. 5
Fig. 5
CeO2NPs and HDM alter airway mucin and marker expression after repeat exposure. Mice (n = 6–7 per treatment group) were exposed to CeO2NPs at either low dose (CeLD) (75 μg/kg) or high dose (CeHD) (750 μg/kg) with and without HDM (1.25 mg/kg), according to instillation protocols described in Fig. 1. Lung tissue was fixed and sections processed for PAS staining (a; Top panels) or immunohistochemical detection of CLCA1 protein (a; Bottom panels). Representative images are displayed with a scale bar of 100 μm. Quantification of airway mucin positive cells was also carried out and displayed as mean ± SEM PAS score (b). Total lung mRNA was also examined for mucin related gene expression by RT-PCR analysis (C-E) and results expressed as mean ± SEM fold over control (F.O.C.) levels. Statistical significance between treatments was assessed using one way ANOVA. Comparisons between particle and HDM treatments alone and control levels are represented as (* p < 0.05), while comparisons between particle + HDM combinations and HDM levels are represented as (# p < 0.05)
Fig. 6
Fig. 6
Airway structure and lung function assessment after repeat CeO2NPs and HDM exposure. Mice (n = 6–7 per treatment group) were exposed to CeO2NPs at the higher dose (CeHD) (750 μg/kg) with and without HDM (1.25 mg/kg) 9 times over a period of 3 weeks. Lung tissue was fixed and sections processed for Masson’s Trichrome (M.T.) staining (a; Top panels) and immunohistochemical detection of α-sma (a; Middle panels) or PCNA (a; Bottom panels). Representative images are displayed with a scale bar of 100 μm. Mice were also assessed for airway hyperresponsiveness to increasing concentrations of inhaled methacholine aerosol (b-d) using the forced oscillation technique. Respiratory system resistance (Rrs) (b), elastance (Ers) (d) as well as Newtonian resistance (RN) (c) and tissue elastance (H) (e) were calculated within flexivent system software and expressed as mean + SEM cmH2O. Statistical significance between treatments at each concentration of methacholine was carried out using student t-test (* p < 0.05) compared to control group
Fig. 7
Fig. 7
Inflammatory responses within the lung after single CeO2NPs and HDM exposure. Mice (n = 6 per treatment group) were exposed to CeO2NPs at either low dose (CeLD) (75 μg/kg) or high dose (CeHD) (750 μg/kg) with and without HDM (1.25 mg/kg) for 24 h. After treatment, bronchoalveolar cells were analysed for differential immune cell content. Results are expressed as mean ± SEM % total cells counted (300–500 per animal) (a). After treatment, total lung mRNA was isolated and examined for transcript levels of the indicated inflammatory markers by RT-PCR analysis with results expressed as mean ± SEM fold over control (F.O.C.) levels (b). BAL fluid was also examined for protein levels of inflammatory cytokines by ELISA (c) and results expressed as mean ± SEM pg/ml. Statistical significance between treatments was assessed using one way ANOVA. Comparisons between particle and HDM treatments alone and control levels are represented as (* p < 0.05), while comparisons between particle + HDM combinations and HDM levels are represented as (# p < 0.05)
Fig. 8
Fig. 8
RNA-Seq analysis after single CeO2NPs and HDM exposure. Mice (n = 5 per treatment group) were exposed to HDM (1.25 mg/kg) alone or in combination with CeO2NPs at the higher dose (CeHD) (750 μg/kg) for 24 h. Total lung mRNA was isolated and Truseq library prepared prior to 90PE sequencing analysis. RPKM normalised counts were analysed for statistically differentially regulated transcripts between all exposure groups using Qlucore software (p < 0.005) using a 2 fold cut-off. Significantly regulated transcripts were visualised as a heatmap of normalised RPKM values (a). Regulated transcripts induced by HDM were analysed for pathway association using IPA analysis with results displayed as statistically ranked associations (b). Selected transcript expression is shown as mean ± SEM fold over control RPKM values (c). Statistical significance between treatments was assessed using one way ANOVA. Comparisons between control (CTRL) and HDM treatments are represented as (* p < 0.05), while HDM vs HDM + CeHD are represented as (# p < 0.05). The most highly regulated transcripts by HDM + CeHD over HDM levels are displayed (d)

References

    1. Qiao ZA, Wu Z, Dai S. Shape-controlled ceria-based nanostructures for catalysis applications. ChemSusChem. 2013;6(10):1821–1833. doi: 10.1002/cssc.201300428. - DOI - PubMed
    1. Fan L, Wang C, Chen M, Zhu B. Recent development of ceria-based (nano)composite materials for low temperature ceramic fuel cells and electrolyte-free fuel cells. J Power Sources. 2013;234:154–174. doi: 10.1016/j.jpowsour.2013.01.138. - DOI
    1. Dale JG, Cox SS, Vance ME, Marr LC, Hochella MF., Jr Transformation of cerium oxide nanoparticles from a diesel fuel additive during combustion in a diesel engine. Environ Sci Technol. 2017;51(4):1973–1980. doi: 10.1021/acs.est.6b03173. - DOI - PubMed
    1. Sims CM, Hanna SK, Heller DA, Horoszko CP, Johnson ME, Montoro Bustos AR, et al. Redox-active nanomaterials for nanomedicine applications. Nano. 2017;9(40):15226–15251. - PMC - PubMed
    1. DeCoteau W, Heckman KL, Estevez AY, Reed KJ, Costanzo W, Sandford D, et al. Cerium oxide nanoparticles with antioxidant properties ameliorate strength and prolong life in mouse model of amyotrophic lateral sclerosis. Nanomedicine. 2016;12(8):2311–2320. doi: 10.1016/j.nano.2016.06.009. - DOI - PubMed

Publication types

MeSH terms