. 2018 Jul 11;131(13):jcs213579.
doi: 10.1242/jcs.213579.

PEDF regulates plasticity of a novel lipid-MTOC axis in prostate cancer-associated fibroblasts

Affiliations

PEDF regulates plasticity of a novel lipid-MTOC axis in prostate cancer-associated fibroblasts

Francesca Nardi et al. J Cell Sci. .

Abstract

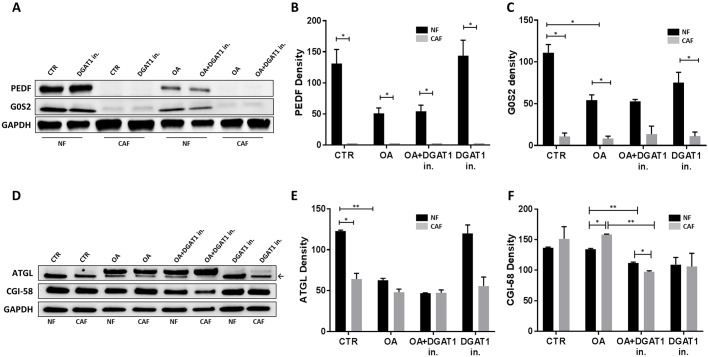
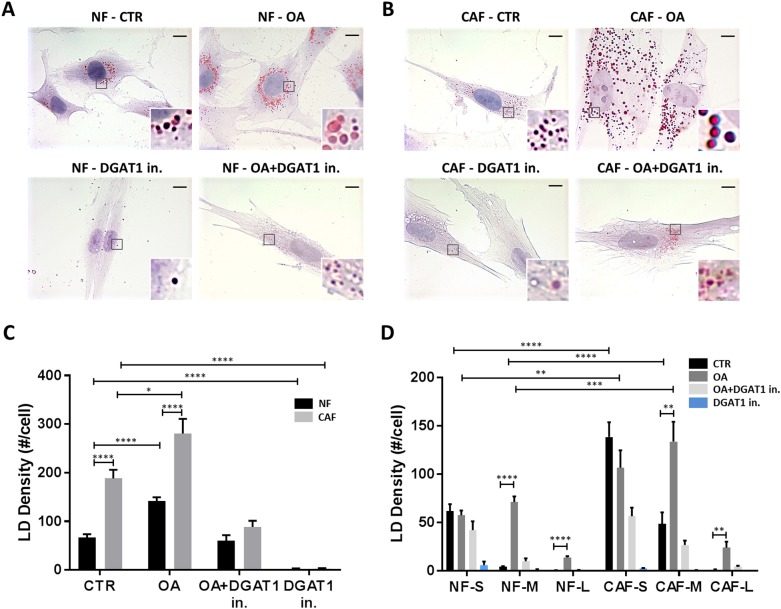
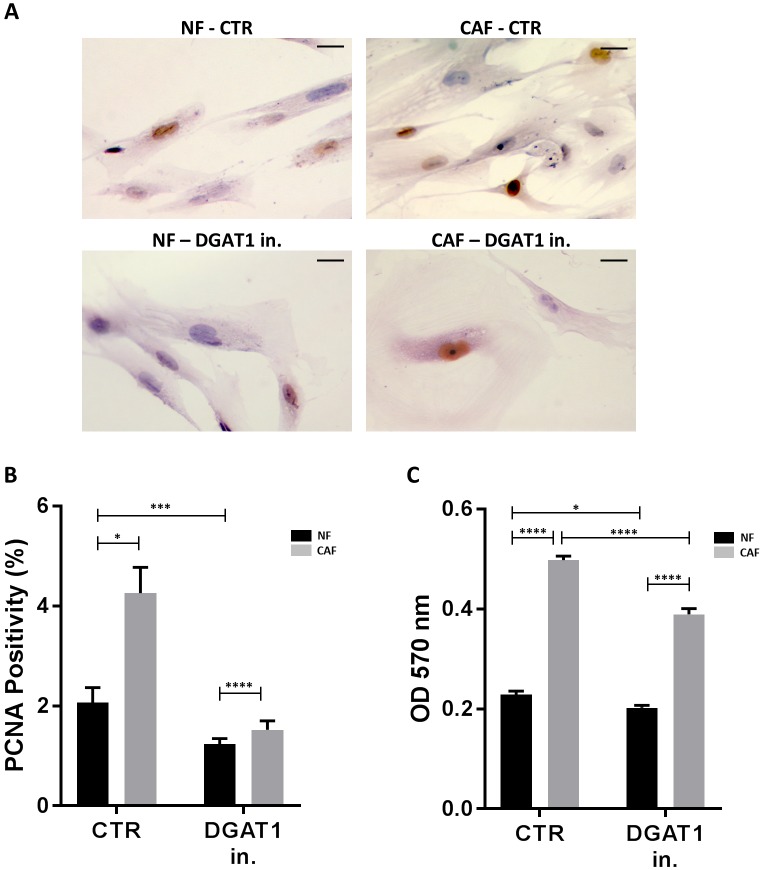
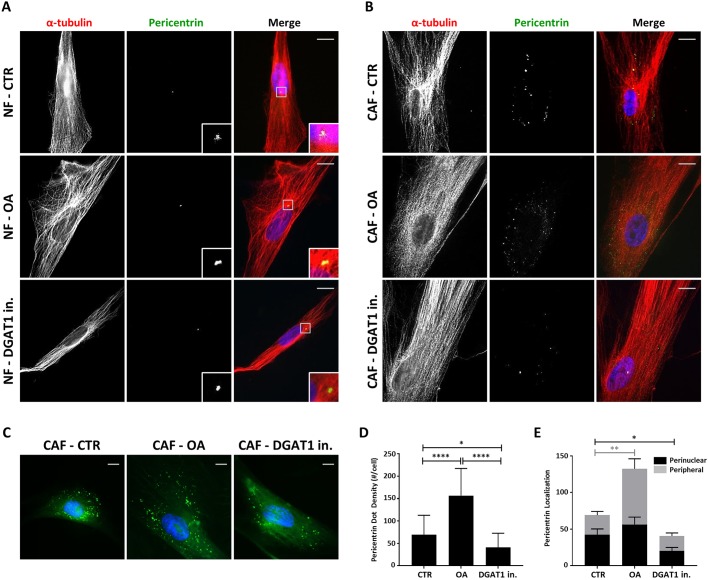
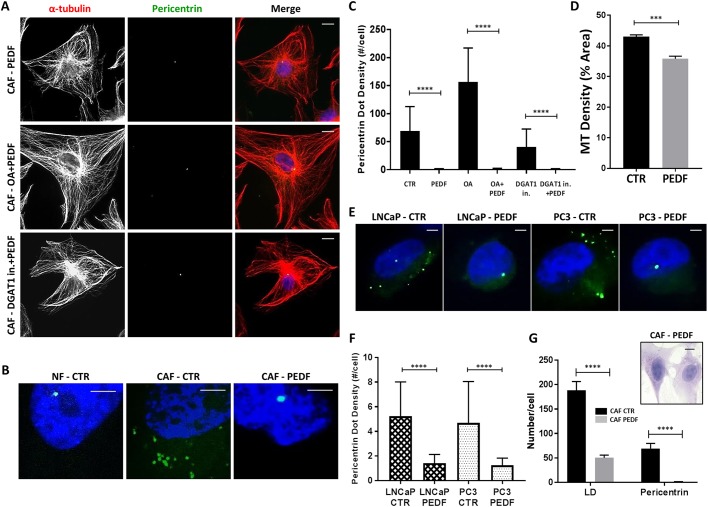
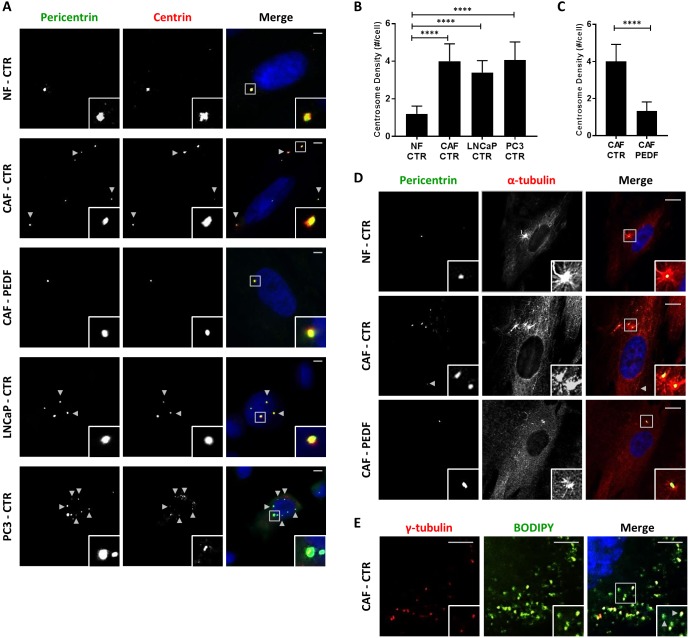
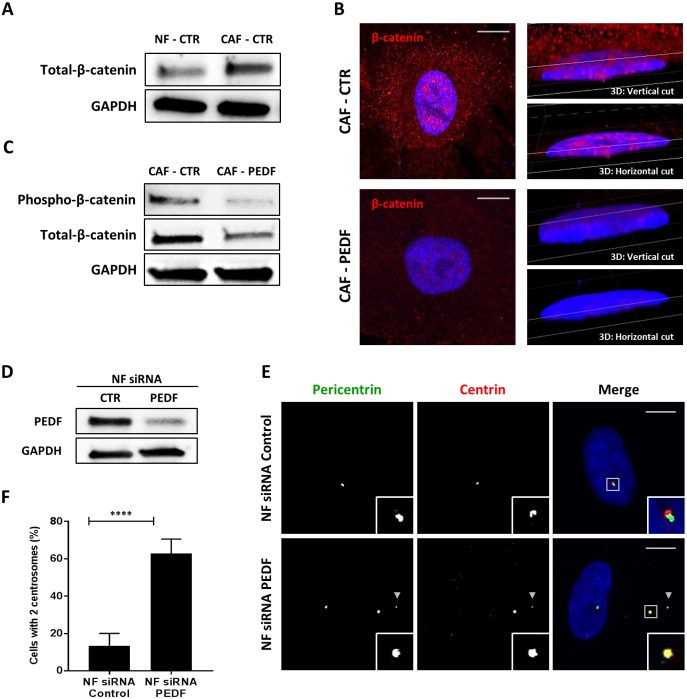
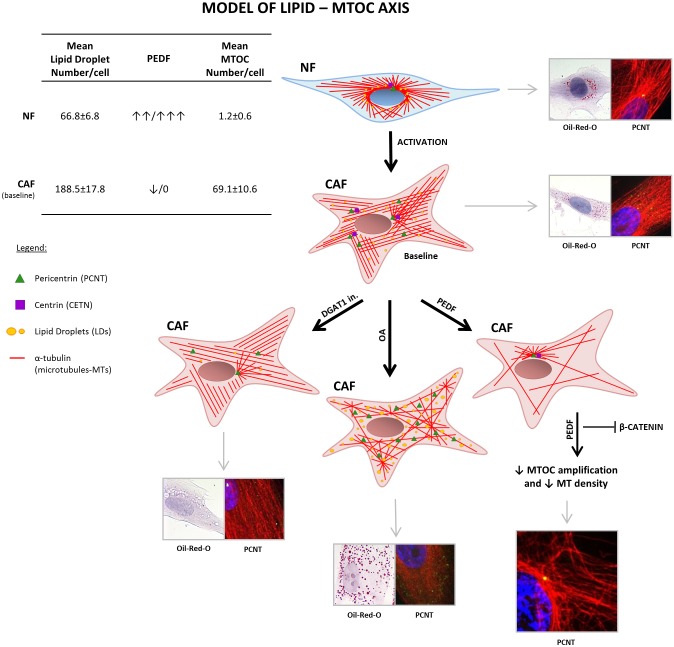
Prostate tumors make metabolic adaptations to ensure adequate energy and amplify cell cycle regulators, such as centrosomes, to sustain their proliferative capacity. It is not known whether cancer-associated fibroblasts (CAFs) undergo metabolic re-programming. We postulated that CAFs augment lipid storage and amplify centrosomal or non-centrosomal microtubule-organizing centers (MTOCs) through a pigment epithelium-derived factor (PEDF)-dependent lipid-MTOC signaling axis. Primary human normal prostate fibroblasts (NFs) and CAFs were evaluated for lipid content, triacylglycerol-regulating proteins, MTOC number and distribution. CAFs were found to store more neutral lipids than NFs. Adipose triglyceride lipase (ATGL) and PEDF were strongly expressed in NFs, whereas CAFs had minimal to undetectable levels of PEDF or ATGL protein. At baseline, CAFs demonstrated MTOC amplification when compared to 1-2 perinuclear MTOCs consistently observed in NFs. Treatment with PEDF or blockade of lipogenesis suppressed lipid content and MTOC number. In summary, our data support that CAFs have acquired a tumor-like phenotype by re-programming lipid metabolism and amplifying MTOCs. Normalization of MTOCs by restoring PEDF or by blocking lipogenesis highlights a previously unrecognized plasticity in centrosomes, which is regulated through a new lipid-MTOC axis.This article has an associated First Person interview with the first author of the paper.

Keywords: ATGL (PNPLA2); CAF; Centrosome; MTOC; PEDF (SERPINF); β-catenin.


Conflict of interest statement

Competing interestsThe authors declare no competing or financial interests.

Figures

Fig. 1.
Fig. 1.
Deficiency of PEDF in CAFs and modulation of TAG-related proteins. (A) Western blot analysis of PEDF (50 kD) and G0S2 (11 kD) levels in NF and CAF control (CTR) cells and in NFs and CAFs treated with DGAT1 inhibitor (DGAT1in.), OA or both (OA+DGAT1 in). (B) PEDF density normalized to that of GAPDH in NFs and CAFs treated as in A. (C) G0S2 density normalized b to that of GAPDH in NFs and CAFs treated as in A. (D) Western blot analysis of ATGL (56 kD) and CGI-58 (40 kD) levels in NF and CAF control (CTR) cells and in NFs and CAFs treated with OA, DGAT1 inhibitor or OA+DGAT1 inhibitor. The weaker bands (indicated by the arrow) were used for the quantification analysis in E and F. (E) ATGL density normalized to that of GAPDH in NFs and CAFs treated as in A. (F) CGI-58 density normalized to that of GAPDH in NFs and CAFs treated as in A. Western blot analysis was replicated at least three times and performed in triplicate. Values are the means±s.e.m. Student's unpaired t-test. *P<0.05, **P<0.01.
Fig. 2.
Fig. 2.
Higher density and diffuse localization of large LDs in CAFs versus NFs. (A,B) NFs (A) and CAFs (B) were treated with 200 µM OA, 1 µM DGAT1 inhibitor or 200 µM OA+DGAT1 inhibitor for 24 h. After fixation, LDs were visualized with Oil-Red-O (red). Scale bars: 10 µm. (C) Average of the total number of LDs per NF (black) and CAF (gray). (D) Number of LDs per cell and LD size defined by the area: small (0.1-1.00 µm2), medium (M) (1.1-2.5 µm2) and large (L) (>2.5 µm2). n=65. The analysis was replicated at least three times and performed in triplicate. Values are means±s.e.m. Student's unpaired t-test. *P<0.05, **P<0.01, ***P<0.001, ****P<0.0001.
Fig. 3.
Fig. 3.
DGAT1 inhibitor treatment reduces cell proliferation in NFs and CAFs. (A) NFs and CAFs were treated with DGAT1 inhibitor (DGAT1in.) for 24 h, and after fixation, the cells were stained with PCNA antibody. Scale bars: 10 μm. (B) Percentage of cells positive for PCNA staining/total cells was evaluated. n=200 cells. (C) NFs and CAFs were treated with DGAT1 inhibitor and the proliferation rate was analyzed by the MTT Proliferation Assay. n=50 cells. The cell proliferation analysis was replicated at least three times and performed in triplicate. Values are means±s.e.m. Student's unpaired t-test. *P<0.05, ***P<0.001, ****P<0.0001.
Fig. 4.
Fig. 4.
Amplification and plasticity of MTOCs in CAFs. NFs (A) and CAFs (B) were stained for α-tubulin (red) and pericentrin (green) to visualize the MT network and the MTOCs, respectively. The nucleus was stained blue by DAPI. Scale bars: 10 µm. (C) CAFs were treated with OA or DGAT1 inhibitor and compared to untreated controls (CAF CTR). The cells were stained with mouse anti-pericentrin antibody and DAPI to identify the MTOCs (green) and nucleus (blue), respectively. Scale bars: 10 µm. (D) The total number of pericentrin-stained MTOCs was counted per single cell. (E) The number of pericentrin-stained MTOCs was stratified based on their localization: perinuclear (black) and peripheral (gray) regions. n=50. All the experiments were replicated at least 3 times and performed in triplicate. Values are means±s.e.m. Student's unpaired t-test. *P<0.05, **P<0.001, ****P<0.0001.
Fig. 5.
Fig. 5.
Restoration of PEDF normalizes MTOC number and MT density. CAFs were treated with 10 nM PEDF±200 µM OA or 1 µM DGAT1 inhibitor for 48 h. (A) CAFs were stained with rabbit anti-α-tubulin, mouse anti-pericentrin antibodies and DAPI to show the MT network (red), the MTOCs (green) and the nucleus (blue), respectively. Scale bars: 10 µm. (B) CAFs were stained with mouse anti-pericentrin antibody (green) and DAPI (blue) to visualize the MTOCs and the nucleus, respectively. Scale bars: 5 µm. (C) The number of pericentrin foci was counted in CAFs. n=50. (D) MT density was determined by the area occupied by microtubules (in %) per cell occupied by microtubules. n=50. (E) LNCaP and PC3 cells were stained with mouse anti-pericentrin antibody and DAPI to visualize the MTOCs (green) and the nucleus (blue), respectively. Scale bars: 10 µm. (F) The number of pericentrin-positive foci in LNCaP and PC3 per single cell. n=50. (G) The change in MTOCs and LD densities were analyzed in CAFs treated with PEDF versus the control (CTR). Neutral lipids in LDs were stained with Oil-Red-O (red) in CAFs treated with PEDF. Scale bar: 10 µm. n=50. All the experiments were replicated at least 3 times and performed in triplicate. Values are means±s.e.m. Student's unpaired t-test. ***P<0.001, ****P<0.0001.
Fig. 6.
Fig. 6.
CAFs demonstrate amplification of both cMTOCs and ncMTOCs. (A) NFs, CAFs, LNCaP and PC3 cells were stained with mouse anti-pericentrin, rabbit anti-centrin 1 antibodies and DAPI to visualize the cMTOCs (green) and/or ncMTOCs (red) and the nucleus (blue), respectively. Scale bars: 5 μm. (B) The number of centrosomes was counted in NFs, CAFs, LNCaP and PC3 cells. n=25. (C) The number of centrosomes was counted in CAFs treated with PEDF and compared to CAFs baseline. n=25. (D) MT regrowth assay was performed in NFs and CAFs and the cells were fixed after 30 s and stained for pericentrin and α-tubulin. Scale bars: 10 μm. (E) CAFs were stained with mouse anti-γ-tubulin antibody, BODIPY and DAPI to visualize γ-tubulin (red), lipid droplets (green) and nuclei (blue), respectively. Scale bars: 5 μm. Arrowheads indicate colocalization; boxed areas in merged images indicate the magnified areas in bottom right corner of each image. n=50. All the experiments were replicated at least 3 times and performed in triplicate.
Fig. 7.
Fig. 7.
PEDF acts as a Wnt inhibitor and decreases the expression of β-catenin in CAFs. CAFs were treated with 10 nM PEDF for 48 h. (A) Total-β-catenin (92 kD) levels were evaluated in NFs and CAFs by western blotting and normalized against those of GAPDH. (B) CAFs were stained with rabbit anti-β-catenin and DAPI to, respectively, visualize the intracellular localization of β-catenin (red) in the cytoplasm and in the nucleus (blue). To analyze whether the protein was localized inside the nucleus, z-stack analysis was performed. Scale bars: 10 µm. (C) Western blot analysis of levels of total-β-catenin and of β-catenin phosphorylated at Y142 normalized to those of GAPDH in untreated CAFs (CTR) and in CAFs treated with PEDF. (D) Western blot analysis of NFs transfected with siRNA targeting PEDF or with control siRNA. (E) NFs transfected with siRNA targeting PEDF or with control siRNA were stained with mouse anti-pericentrin, rabbit anti-centrin 1 antibodies and DAPI to, respectively, visualize the cMTOCs (green), ncMTOCs (red) and the nucleus (blue). Scale bars: 10 µm. (F) The number of centrosomes was evaluated in NFs silenced for PEDF and in its negative control. n=50. All the experiments were replicated at least 3 times and performed in triplicate. Values are means±s.e.m. Student's unpaired t-test. ****P<0.0001.
Fig. 8.
Fig. 8.
Proposed model of the lipid–MTOC axis. NFs have a single perinuclear centrosome (indicated by one single pericentrin-positive dot) with an organized radial MT network around the nucleus (see PCNT insert for NFs). In contrast, CAFs at baseline exhibit centrosome and/or MTOC amplification (mean MTOC number/cell: 69.1±10.6) in addition to a more complex MT network. Moreover, CAFs at baseline have more stored neutral lipids than NFs (mean LD number/cell in CAF vs NF: 188.5±17.8 vs 66.8±6.8). The addition of PEDF normalizes the number of MTOCs in CAFs and reduces the density of MTs (see the PCNT insert for CAFs treated with PEDF). One possible mechanism for these activities is that PEDF acts as a potent Wnt-signaling inhibitor and reduces the levels of activated β-catenin. Also, the treatment with a DGAT1 inhibitor results in a decrease in the number of both LDs and MTOCs, whereas addition of the lipogenic stimulus OA significantly increases their number (see Oil-Red-O and PCNT inserts for CAFs treated with DGAT1 inhibitor and OA, respectively). In CAFs at baseline, 30-40% of LDs switch to a MTOC-like phenotype and carry the key MTOC matrix proteins pericentrin and/or γ-tubulin on their surface (see Fig. 6E). These data suggest that lipid-laden CAFs can modulate MTOC numbers through a new PEDF-dependent lipid-MTOC axis.

Similar articles

Cited by

References

    1. Bahmanyar S., Guiney E. L., Hatch E. M., Nelson W. J. and Barth A. I. M. (2010). Formation of extra centrosomal structures is dependent on beta-catenin. J. Cell Sci. 123, 3125-3135. 10.1242/jcs.064782 - DOI - PMC - PubMed
    1. Banerjee J., Mishra R., Li X., Jackson R. S. II, Sharma A. and Bhowmick N. A. (2014). A reciprocal role of prostate cancer on stromal DNA damage. Oncogene 33, 4924-4931. 10.1038/onc.2013.431 - DOI - PMC - PubMed
    1. Banerjee S., Zare R. N., Tibshirani R. J., Kunder C. A., Nolley R., Fan R., Brooks J. D. and Sonn G. A. (2017). Diagnosis of prostate cancer by desorption electrospray ionization mass spectrometric imaging of small metabolites and lipids. Proc. Natl. Acad. Sci. USA 114, 3334-3339. 10.1073/pnas.1700677114 - DOI - PMC - PubMed
    1. Bartolini F. and Gundersen G. G. (2006). Generation of noncentrosomal microtubule arrays. J. Cell Sci. 119, 4155-4163. 10.1242/jcs.03227 - DOI - PubMed
    1. Becerra S. P. and Notario V. (2013). The effects of PEDF on cancer biology: mechanisms of action and therapeutic potential. Nat. Rev. Cancer 13, 258-271. 10.1038/nrc3484 - DOI - PMC - PubMed

Publication types

MeSH terms