

Ability of crime, demographic and business data to forecast areas of increased violence
- PMID: 29792563
- PMCID: PMC6343653
- DOI: 10.1080/17457300.2018.1467461
Ability of crime, demographic and business data to forecast areas of increased violence
Abstract
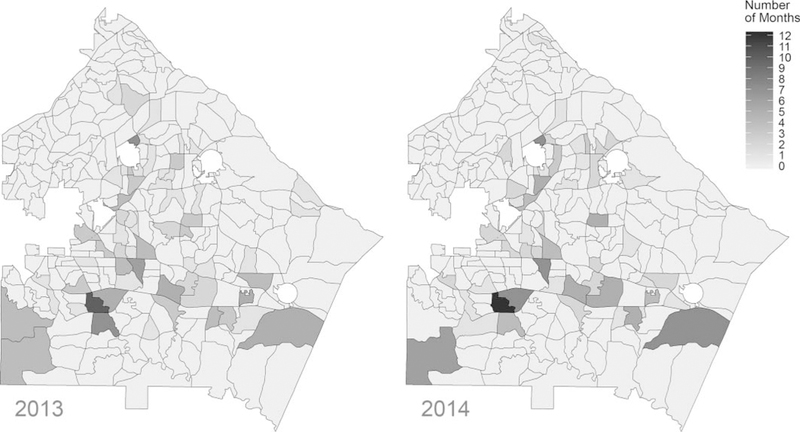
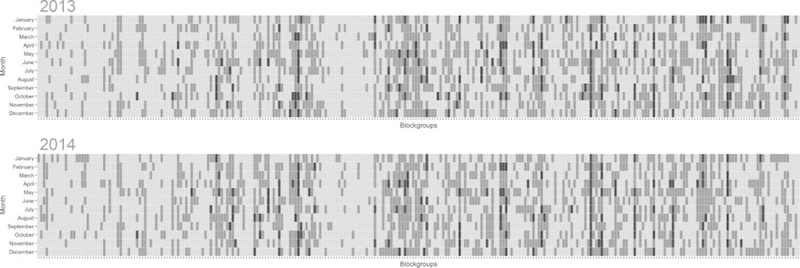
Identifying geographic areas and time periods of increased violence is of considerable importance in prevention planning. This study compared the performance of multiple data sources to prospectively forecast areas of increased interpersonal violence. We used 2011-2014 data from a large metropolitan county on interpersonal violence (homicide, assault, rape and robbery) and forecasted violence at the level of census block-groups and over a one-month moving time window. Inputs to a Random Forest model included historical crime records from the police department, demographic data from the US Census Bureau, and administrative data on licensed businesses. Among 279 block groups, a model utilizing all data sources was found to prospectively improve the identification of the top 5% most violent block-group months (positive predictive value = 52.1%; negative predictive value = 97.5%; sensitivity = 43.4%; specificity = 98.2%). Predictive modelling with simple inputs can help communities more efficiently focus violence prevention resources geographically.
Keywords: Violence; crime forecasting; machine learning; violent injuries.
Conflict of interest statement
Disclosure statement
We declare no competing interests.
Figures
References
-
- Amandus HE, Zahm D, & Friedmann R, Ruback RB, Block C, Weiss J, … Kessler D (1996). Employee injuries and convenience store robberies in selected metropolitan areas. Journal of Occupational and Environmental Medicine, 38(7), 714–720. - PubMed
-
- Berk RA, & Bleich J (2013). Statistical procedures for forecasting criminal behavior. Criminology & Public Policy, 12(3), 513–544.
-
- Bogomolov A, Lepri B, Staiano J, Oliver N, Pianesi F, & Pentland A (2014). Once upon a crime: Towards crime prediction from demographics and mobile data. In Proceedings of the 16th international conference on multimodal interaction (pp. 427–434). Istanbul, Turkey: ACM.
-
- Butts JA, Roman CG, Bostwick L, & Porter JR (2015). Cure violence: A public health model to reduce gun violence. Annual Review of Public Health, 36, 39–53. - PubMed
-
- Chen C, Liaw A, & Breiman L (2004). Using random forest to learn imbalanced data (pp. 1–12). Berkeley: University of California.
MeSH terms
Grants and funding
LinkOut - more resources
Full Text Sources
Other Literature Sources