. 2018 May 24:7:e35103.
doi: 10.7554/eLife.35103.

Increasing plant diversity with border crops reduces insecticide use and increases crop yield in urban agriculture

Affiliations

Increasing plant diversity with border crops reduces insecticide use and increases crop yield in urban agriculture

Nian-Feng Wan et al. Elife. .

Abstract

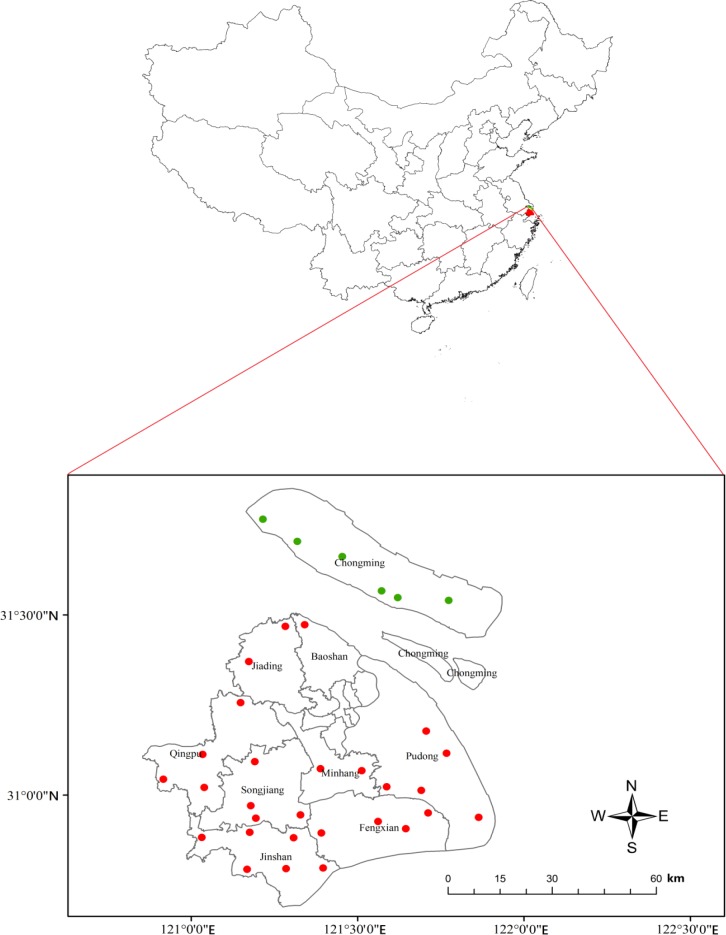
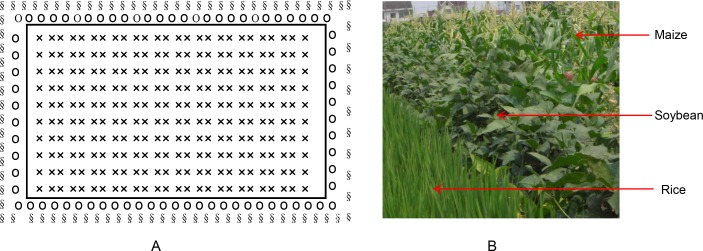
Urban agriculture is making an increasing contribution to food security in large cities around the world. The potential contribution of biodiversity to ecological intensification in urban agricultural systems has not been investigated. We present monitoring data collected from rice fields in 34 community farms in mega-urban Shanghai, China, from 2001 to 2015, and show that the presence of a border crop of soybeans and neighboring crops (maize, eggplant and Chinese cabbage), both without weed control, increased invertebrate predator abundance, decreased the abundance of pests and dependence on insecticides, and increased grain yield and economic profits. Two 2 year randomized experiments with the low and high diversity practices in the same locations confirmed these results. Our study shows that diversifying farming practices can make an important contribution to ecological intensification and the sustainable use of associated ecosystem services in an urban ecosystem.

Keywords: Chinese cabbage; ecology; eggplant; maize; predator; rice; soybean.


Conflict of interest statement

NW, YC, YS, XJ, XW, XZ, WC, JL, YJ, XC, JW, JJ, MN, RJ, TY, JT, WT, HZ, BL No competing interests declared

Figures

Figure 1.
Figure 1.. Twenty-eight mono-rice (red dots) and six plant-diversified community farms (green dots) monitored in Shanghai, China.
Figure 2.
Figure 2.. Population dynamics of pink rice borer and brown planthopper trapped in the lamp and rice leaf roller observed in rice fields on plant-diversified and mono-rice farms from 2001 to 2015.
(A) and (B) Pink rice borer; (C) and (D) Rice brown planthopper; (E) and (F) Rice leaf roller. The blue and red lines (in Figure 6A, C and E) indicate the plant-diversified and mono-rice farms, respectively. Vertical bars on each point denote SE. From 2001 to 2015, the number of trapped pink rice borers and rice brown planthoppers, and the population densities of rice leaf rollers were monitored from 10 April to 30 September, 11 May to 30 September, and 11 June to 20 September, respectively.
Figure 3.
Figure 3.. Abundance of predators observed on plant-diversified and mono-rice farms for each year.
Abundance of predators in the rice fields was sampled at an interval of 15–20 days (with minor variation due to weather conditions) from seedling stage to grain stage from 2007 to 2015. Vertical bars on each point denote SE.
Figure 4.
Figure 4.. Predator abundance on the border crop of soybeans and neighboring crops (maize, eggplant and Chinese cabbage) on plant-diversified farms.
(A) Predator abundance in different years; and (B) Predator abundance on four crops (soybean, maize, eggplant and Chinese cabbage). Abundance of predators (ladybird beetles, lacewings and spiders) were monitored in soybeans from 2007 to 2014 and in neighboring crops (maize, eggplant and Chinese cabbage) during 2009–2011 and 2013–2014. Vertical bars on each point denote SE.
Figure 5.
Figure 5.. Dynamics of the number of insecticide sprays, the amount of insecticide sprayed and grain yield per crop on plant-diversified and mono-rice farms from 2001 to 2015.
(A) Number of insecticide sprays; (B) Amount of commercial insecticide sprayed (kg•ha−1); (C) Amount of active ingredient in insecticide sprayed (kg•ha−1); and (D) Grain yield (t•ha−1). Vertical bars on each point denote SE.
Figure 6.
Figure 6.. Effects of plant diversification in experiment in which plant-diversified with mono-rice farming were compared at the same locations.
(A) Density of rice plant-hoppers sampled in rice field plots; (B) Density of rice stem borers sampled in rice field plots; (C) Density of rice leaf rollers sampled in rice field plots; (D) Density of the predators (ladybird beetles, lacewings and spiders) sampled in rice field plots; (E) Amount of insecticide sprays per rice field plot (kg•ha−1); and (F) Grain yield per rice field (t•ha−1). Vertical bars denote SE.
Figure 6—figure supplement 1.
Figure 6—figure supplement 1.. Predator abundance in the border crop of soybeans and in the neighboring crop of maize sampled in rice field plots.
Vertical bars denote SE.
Figure 7.
Figure 7.. Power analysis results for rice plant-hopper occurrence, where the power are estimated for additional experimental sites (left), additional replicates for each farm type–site–year block (middle), and additional years (right), based on the effect size estimated by the mixed-effect model fitted to the common-location experiment data.
The horizontal line marks the standard power level of 80%. Vertical line denotes the 95% confidence interval for the power estimates.
Figure 8.
Figure 8.. Power analysis results for rice leaf roller occurrence.
See caption of Figure 7—figure supplement 1 for details.
Figure 9.
Figure 9.. Power analysis results for predator abundance.
See caption of Figure 7—figure supplement 1 for details.
Figure 10.
Figure 10.. Power analysis results for grain yield.
See caption of Figure 7—figure supplement 1 for details.
Figure 11.
Figure 11.. A path diagram depicting the hypothesis on the relationships among the variables considered in this study.
‘+' indicates increased level and '-' indicates decreased level.
Figure 12.
Figure 12.. The layout of each rice plots in each community farm and ‘Z’-style grain yield sampling.
On each farm, the rice growing area was divided into nine paddy plots, which were 60–70 × 25–35 m on each plot. Three to six rice field plots of 0.120–0.167 hectares were selected in each community farm to measure the grain yield each year. The rice plants at harvest stage (‘Z’-style sampling with 10, one square meter subplots in each plot) were mowed and threshed, and the grain yield per unit area was obtained. ‘×' and black solid dots denoted rice, and 1 m2 sampling areas for rice grain yield, respectively. The interval between two adjacent black solid dots was about five meters.
Figure 13.
Figure 13.. The layout of plant-diversified fields in which a border crop (soybean) was interplanted around the rice fields and a neighboring crop (maize) was interplanted around the soybeans.
(A) Drawing plot diagram for plant-diversified fields; and (B) the photograph for plant-diversified fields. ‘×', ‘o’ and ‘§' denoted rice, soybean and maize, respectively. The layout of each control rice field was similar, but without soybeans or maize.
Author response image 1.
Author response image 2.
Author response image 2.. The correlation between number of insect pests and number of predators in rice field plots.
Here insect pests included rice planthoppers, rice stem borers, and rice leaf rollers; predators were involved in ladybird beetles, lacewings and spiders.

References

    1. Altieri MA, Companioni N, Cañizares K, Murphy C, Rosset P, Bourque M, Nicholls CI. The greening of the “barrios”: urban agriculture for food security in Cuba. Agriculture and Human Values. 1999;16:131–140. doi: 10.1023/A:1007545304561. - DOI
    1. Barlow J, Lennox GD, Ferreira J, Berenguer E, Lees AC, Mac Nally R, Thomson JR, Ferraz SF, Louzada J, Oliveira VH, Parry L, Solar RR, Vieira IC, Aragão LE, Begotti RA, Braga RF, Cardoso TM, de Oliveira RC, Souza CM, Moura NG, Nunes SS, Siqueira JV, Pardini R, Silveira JM, Vaz-de-Mello FZ, Veiga RC, Venturieri A, Gardner TA. Anthropogenic disturbance in tropical forests can double biodiversity loss from deforestation. Nature. 2016;535:144–147. doi: 10.1038/nature18326. - DOI - PubMed
    1. Barot S, Allard V, Cantarel A, Enjalbert J, Gauffreteau A, Goldringer I, Lata J-C, Le Roux X, Niboyet A, Porcher E. Designing mixtures of varieties for multifunctional agriculture with the help of ecology. A review. Agronomy for Sustainable Development. 2017;37:13. doi: 10.1007/s13593-017-0418-x. - DOI
    1. Bolker BM, Brooks ME, Clark CJ, Geange SW, Poulsen JR, Stevens MH, White JS. Generalized linear mixed models: a practical guide for ecology and evolution. Trends in Ecology & Evolution. 2009;24:127–135. doi: 10.1016/j.tree.2008.10.008. - DOI - PubMed
    1. Bommarco R, Kleijn D, Potts SG. Ecological intensification: harnessing ecosystem services for food security. Trends in Ecology & Evolution. 2013;28:230–238. doi: 10.1016/j.tree.2012.10.012. - DOI - PubMed

Publication types

MeSH terms

LinkOut - more resources