. 2018 Sep:178:183-197.
doi: 10.1016/j.neuroimage.2018.05.049. Epub 2018 May 21.

A computational framework for the detection of subcortical brain dysmaturation in neonatal MRI using 3D Convolutional Neural Networks

Affiliations

A computational framework for the detection of subcortical brain dysmaturation in neonatal MRI using 3D Convolutional Neural Networks

Rafael Ceschin et al. Neuroimage. 2018 Sep.

Abstract

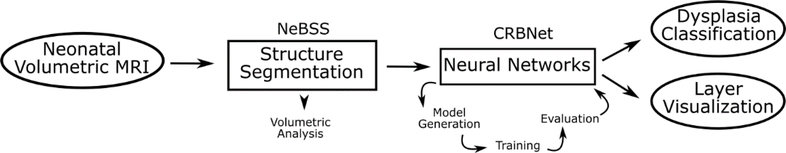
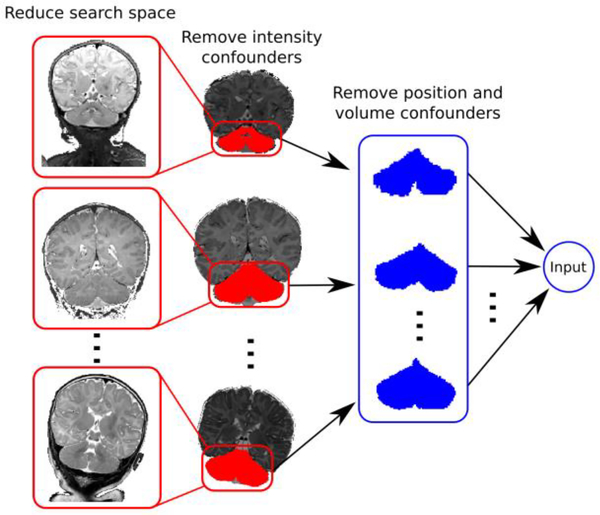
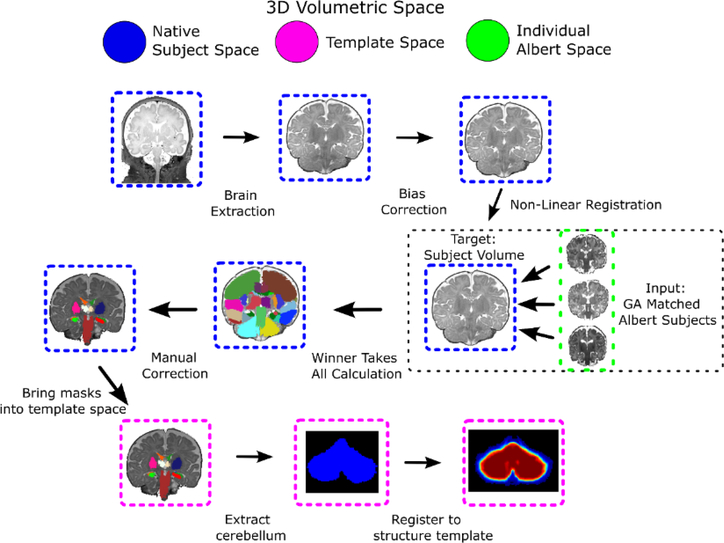
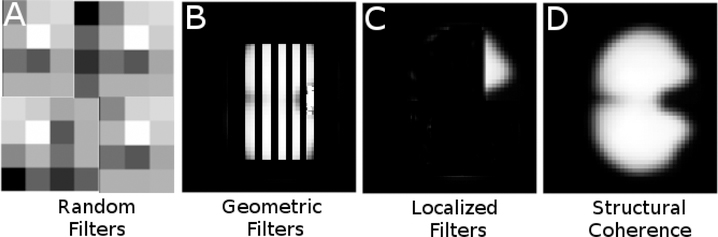
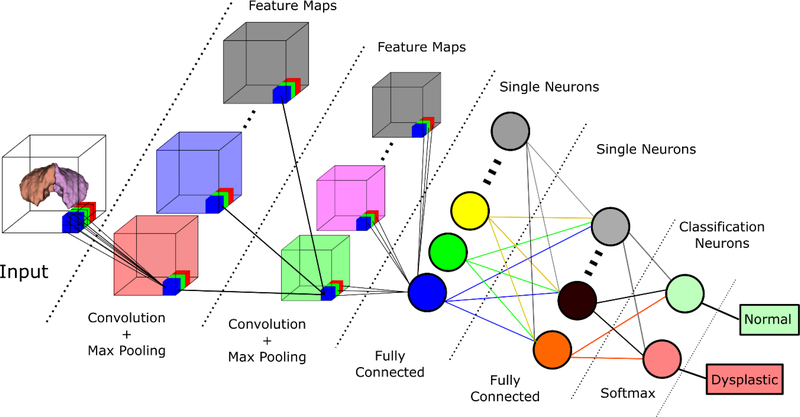
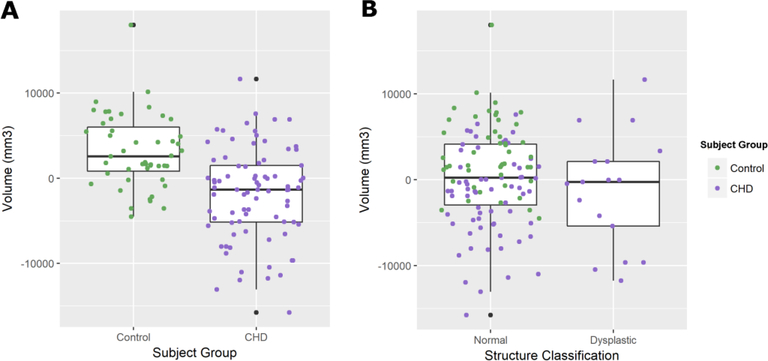
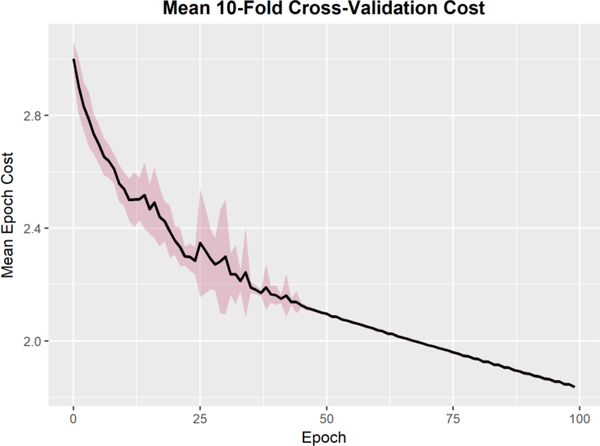
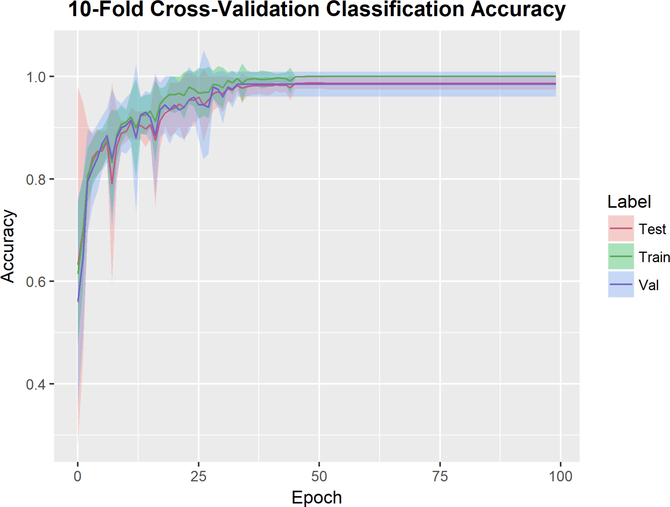
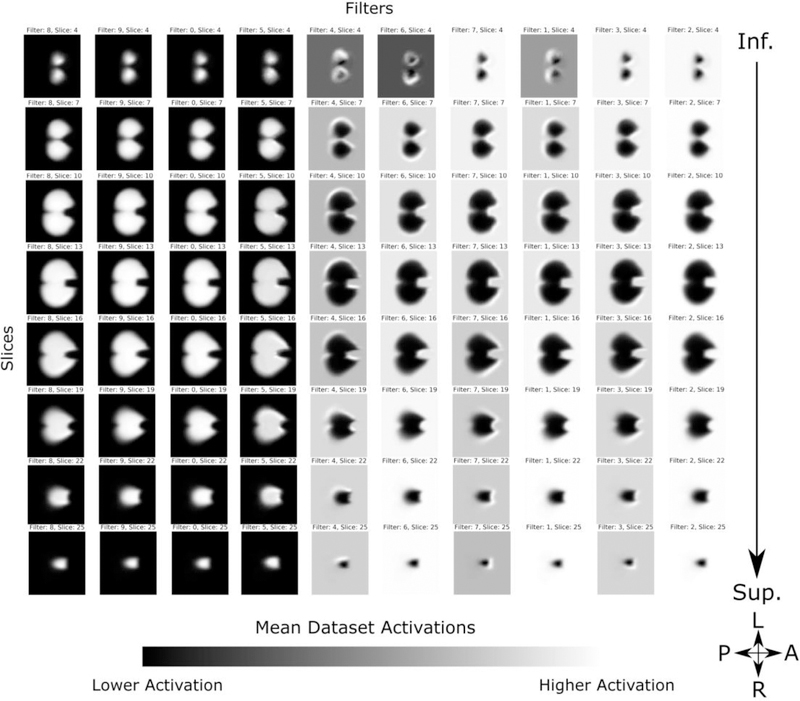
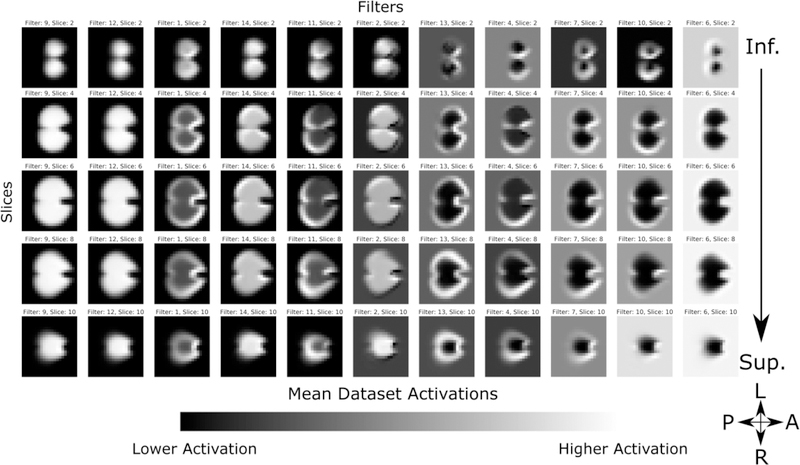
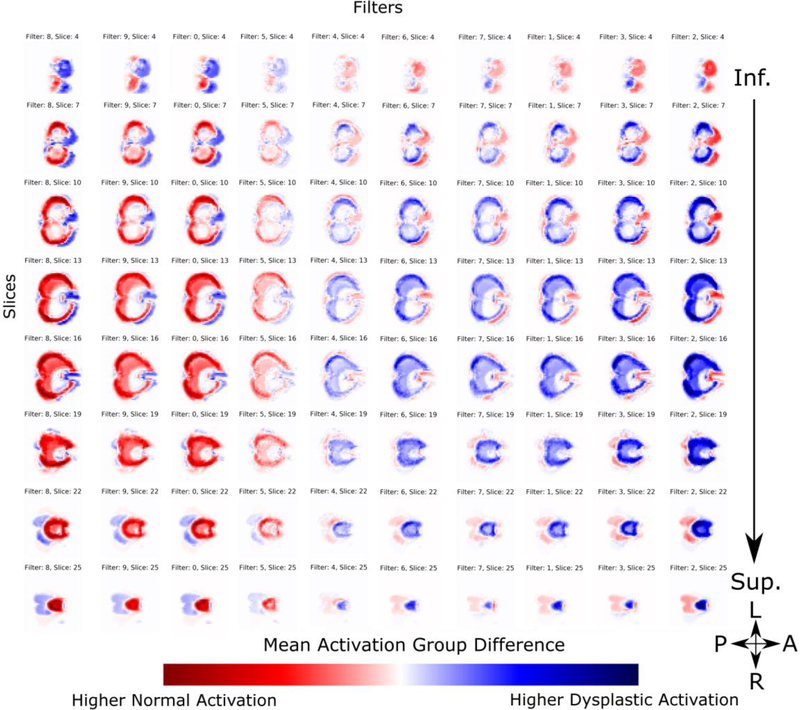
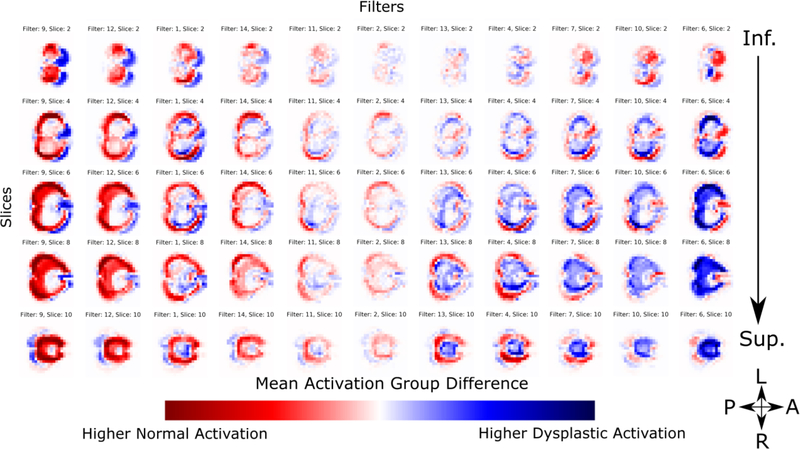
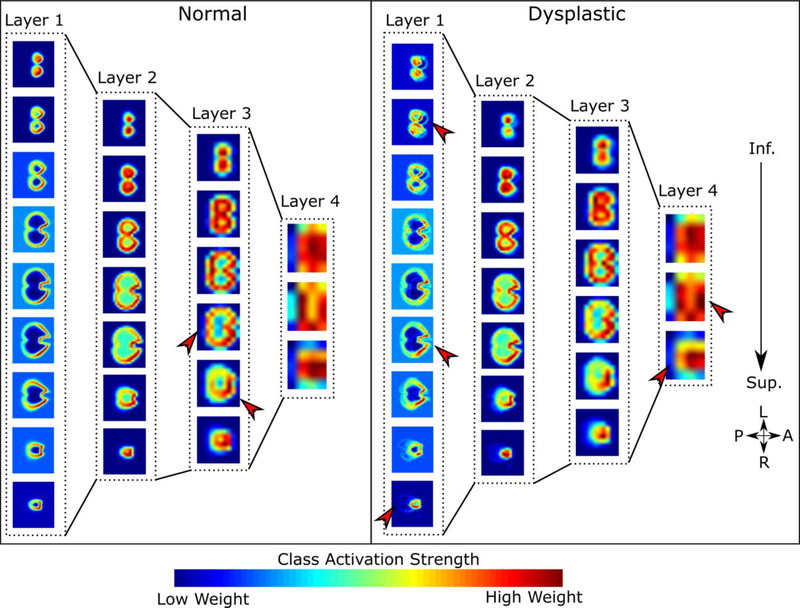
Deep neural networks are increasingly being used in both supervised learning for classification tasks and unsupervised learning to derive complex patterns from the input data. However, the successful implementation of deep neural networks using neuroimaging datasets requires adequate sample size for training and well-defined signal intensity based structural differentiation. There is a lack of effective automated diagnostic tools for the reliable detection of brain dysmaturation in the neonatal period, related to small sample size and complex undifferentiated brain structures, despite both translational research and clinical importance. Volumetric information alone is insufficient for diagnosis. In this study, we developed a computational framework for the automated classification of brain dysmaturation from neonatal MRI, by combining a specific deep neural network implementation with neonatal structural brain segmentation as a method for both clinical pattern recognition and data-driven inference into the underlying structural morphology. We implemented three-dimensional convolution neural networks (3D-CNNs) to specifically classify dysplastic cerebelli, a subset of surface-based subcortical brain dysmaturation, in term infants born with congenital heart disease. We obtained a 0.985 ± 0. 0241-classification accuracy of subtle cerebellar dysplasia in CHD using 10-fold cross-validation. Furthermore, the hidden layer activations and class activation maps depicted regional vulnerability of the superior surface of the cerebellum, (composed of mostly the posterior lobe and the midline vermis), in regards to differentiating the dysplastic process from normal tissue. The posterior lobe and the midline vermis provide regional differentiation that is relevant to not only to the clinical diagnosis of cerebellar dysplasia, but also genetic mechanisms and neurodevelopmental outcome correlates. These findings not only contribute to the detection and classification of a subset of neonatal brain dysmaturation, but also provide insight to the pathogenesis of cerebellar dysplasia in CHD. In addition, this is one of the first examples of the application of deep learning to a neuroimaging dataset, in which the hidden layer activation revealed diagnostically and biologically relevant features about the clinical pathogenesis. The code developed for this project is open source, published under the BSD License, and designed to be generalizable to applications both within and beyond neonatal brain imaging.

Keywords: Congenital heart disease; Deep learning; Neonatal imaging; Structural MR.


Figures

Figure 1.
Figure 1.
Experimental Design and overview of the framework. The pipeline takes as input the neonatal volumetric MRI, and segments 50 individual brain substructures. These substructures can be independently used for volumetric analysis. These structures are then registered onto a standard space to remove any size confounder but retain the shape information. This is the input to the neural network. The architecture of a given network is heuristically determined, followed but training and evaluation of its performance. This is iteratively performed until satisfactory results are achieved. The output of the framework is a classifier able to detect structural dysplasia, and the hidden layers of the chosen network can be used to infer the morphological properties that contribute to the final classifier.
Figure 2.
Figure 2.
Dimensionality reduction of neonatal structural MRI decreases the search space by removing intensity, positional, and size confounders.
Figure 3.
Figure 3.
Neonatal cerebellum structure extraction pipeline. We use an atlas based image registration pipeline to delineate the desired brain structures, which become the input to the classification task.
Figure 4.
Figure 4.
Non-exhaustive, synthetic examples of possible learned filter outcomes when training CNNs. Randomly distributed filters (A) may still result in good classification accuracy, but provide no anatomically interpretable benefits. Geometric filters (B) are often seen in image classification algorithms with no structural coherence of the input data. These filters are typically found in earlier layers of deep networks, and are thought to be used in further layer abstractions to combine to form more complex features. Localized filters (C) can be useful for identifying specific regions of the input image that highly contribute to the final classification. Structurally coherent activation maps, as are generated by our methods due to structural constraints, (D) retain the structure of the input data, and selectively activate regions of the input dataset that contribute to the final classifier.
Figure 5.
Figure 5.
3-D Convolutional Neural Network Overview. Simplified architecture of the generated CNN. The algorithm takes as input the extracted, binarized cerebellum and outputs a classification of dysplastic or normal structure.
Figure 6.
Figure 6.
Boxplots showing post-menstrual age corrected cerebellar for between A) control subjects and patients with CHD and B) Subjects classified as having structurally normal cerebelli and subjects diagnosed with dysplastic cerebelli. Only subjects with CHD were diagnosed with dysplastic cerebelli. There was a statistically significant difference in volumes between neonates with CHD and controls (p < 0.000) but no difference between dysplastic structures and normal structures (p < 0.321), suggesting that hypoplasia is independent from structural dysplasia.
Figure 7.
Figure 7.
10-Fold Cross validation mean and standard deviation cost across all runs. Cost function was the negative log-likelihood function with an L2 regularization parameter of 0.01. While some variance is expected due to the random initialization of weights, all runs converge within 50 epochs.
Figure 8.
Figure 8.
10-Fold Cross validation mean and standard deviation classification error for each dataset. The training set is a bootstrapped dataset with an inflated incidence of abnormal cases. The data is partitioned into 10 independent sets, where at each run 9 are used to train the network and the final set is used as the validation set. All runs achieved 100% classification accuracy in the test set within 50 epochs.
Figure 9.
Figure 9.
First convolutional layer mean activations. Filters are selectively sorted for visual clarity and intensities are scaled to show the contrast in activation range in each filter. Each filter distinctly delineates the cerebellum, with some filters showing higher activations limited to the perimeters of the structure, co-localizing to the cerebellar cortex of the bilateral cerebellar hemispheres, serving as potential edge detectors.
Figure 10.
Figure 10.
Second convolutional layer mean activation. Filters are selectively sorted for visual clarity and intensities are scaled to show the contrast in activation range in each filter. Compared to the first layer, activations show more dramatic delineations of the superior surface of the cerebellum, co-localizing to the posterior subdivision of the bilateral cerebellar hemispheres and midline vermis.
Figure 11.
Figure 11.
First convolutional layer activation difference between control and dysplastic cerebelli. Blue regions are areas in which we see higher activation in the dysplastic cerebelli, and red is increased in the normal substructures. White regions showed low activations equally in both cohorts, and are thus uninformative to the classification task. Filters are selectively sorted for visual clarity to highlight the differences in filters that show higher activations in normal cerebelli contrasted with dysplastic inputs. Each filter shows a predilection for primarily classifying either normal or dysplastic cerebelli, however, some overlap is observed.
Figure 12.
Figure 12.
Second convolutional layer activation difference between control and dysplastic cerebelli. Blue regions are areas in which we see higher activation in the dysplastic cerebelli, and red is increased in the normal substructures. White regions showed low activations equally in both cohorts, and are thus uninformative to the classification task. Filters are selectively sorted for visual clarity to highlight the differences in filters that show higher activations in normal cerebelli contrasted with dysplastic inputs. Compared to the first layer, we see more local delineation of regional cerebellar subdivisions. The superior surface of the cerebellum shows significant discriminatory power, seen as strongly differentiated regions of activation in the outer perimeter of the activation maps, which includes the posterior subdivision of the cerebellar lobes and the midline vermis.
Figure 13.
Figure 13.
Within-Class Average Activation Maps for normal and dysplastic cohorts. Within-Class Average Activation Maps (wCAMs) are constructed at each convolutional layer by calculating a weighted sum of the activations learned for each feature map at that layer. This generates a weighted spatial map across all feature maps that most contribute to the classifier at each layer. Since we have fully connected layers prior to the final classifier, we lose the direct connection of each individual feature map’s contribution to the final classifier. However, it allows us to extract salient anatomical information at each convolutional layer. Notable regional differences between normal and dysplastic variants are shown with red arrows.

References

    1. LeCun Y, Bottou L, Bengio Y, Haffner P. Gradient-based learning applied to document recognition. Proc IEEE. 1998;86(11):2278–2323. doi: 10.1109/5.726791. - DOI
    1. Kleesiek J, Urban G, Hubert A, et al. Deep MRI brain extraction: A 3D convolutional neural network for skull stripping. Neuroimage. 2016;129:460–469. doi: 10.1016/j.neuroimage.2016.01.024. - DOI - PubMed
    1. Brosch T, Tang LYW, Yoo Y, Li DKB, Traboulsee A, Tam R. Deep 3D Convolutional Encoder Networks With Shortcuts for Multiscale Feature Integration Applied to Multiple Sclerosis Lesion Segmentation. IEEE Trans Med Imaging. 2016;35(5):1229–1239. doi: 10.1109/TMI.2016.2528821. - DOI - PubMed
    1. Mueller SG, Weiner MW, Thal LJ, et al. Ways toward an early diagnosis in Alzheimer’s disease: The Alzheimer’s Disease Neuroimaging Initiative (ADNI). Alzheimer’s Dement. 2005;1(1):55–66. doi: 10.1016/j.jalz.2005.06.003. - DOI - PMC - PubMed
    1. Gupta A, Ayhan MS, Maida AS. Natural Image Bases to Represent Neuroimaging Data. http://proceedings.mlr.press/v28/gupta13b.pdf. Accessed October 4, 2017.

Publication types

MeSH terms