. 2018 May 24;18(1):92.
doi: 10.1186/s12870-018-1310-9.

Exposure to lower red to far-red light ratios improve tomato tolerance to salt stress

Affiliations

Exposure to lower red to far-red light ratios improve tomato tolerance to salt stress

Kai Cao et al. BMC Plant Biol. .

Abstract

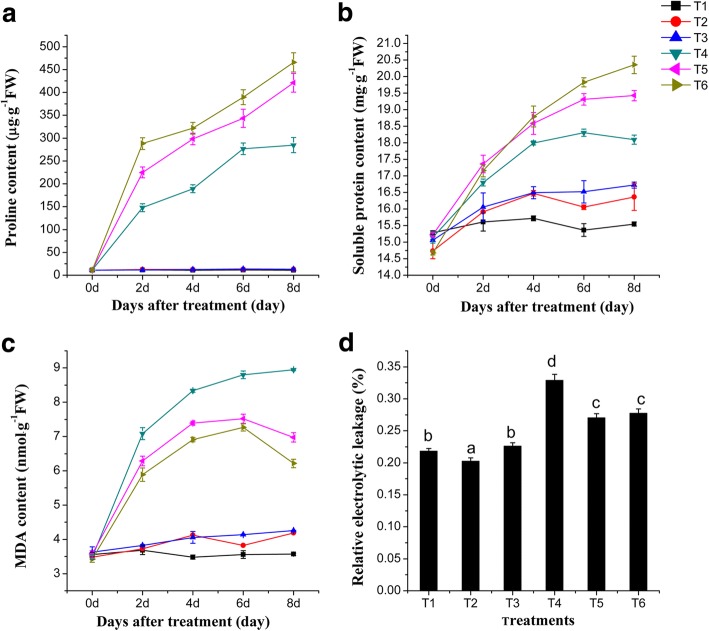
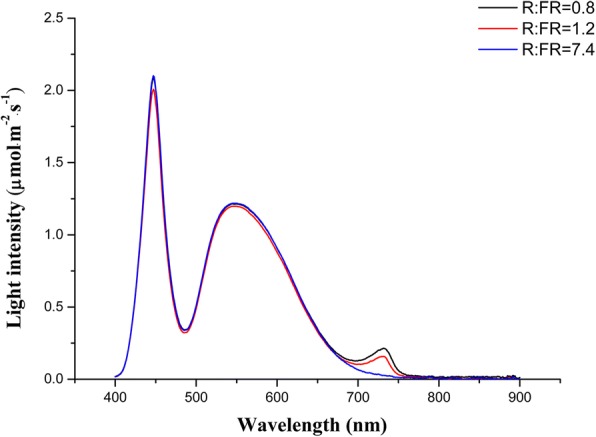
Background: Red (R) and far-red (FR) light distinctly influence phytochrome-mediated initial tomato growth and development, and more recent evidence indicates that these spectra also modulate responses to a multitude of abiotic and biotic stresses. This research investigated whether different R: FR values affect tomato growth response and salinity tolerance. Tomato seedlings were exposed to different R: FR conditions (7.4, 1.2 and 0.8) under salinity stress (100 mM NaCl), and evaluated for their growth, biochemical changes, active reactive oxygen species (ROS) and ROS scavenging enzymes, pigments, rate of photosynthesis, and chlorophyll fluorescence.

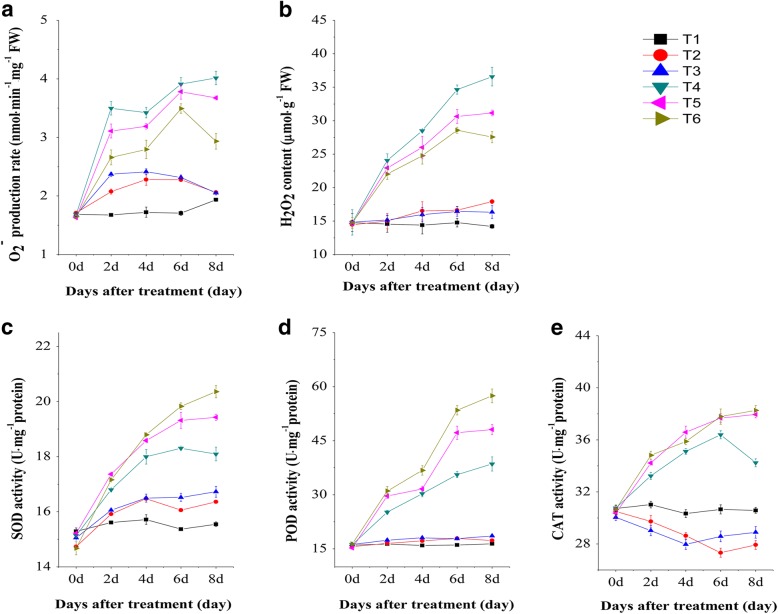
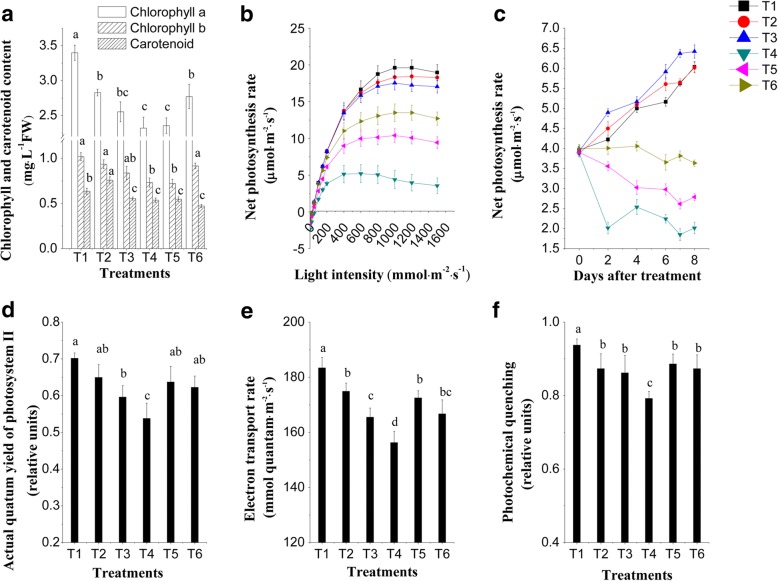
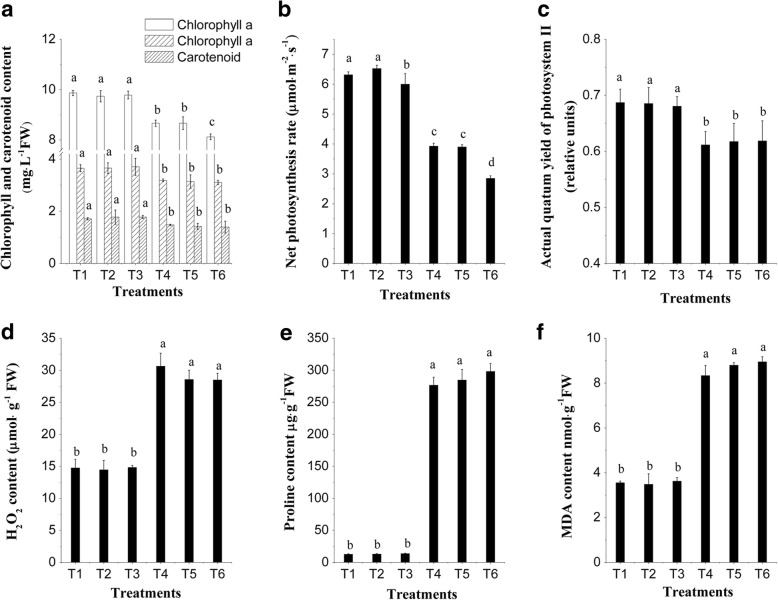
Results: The results showed that under conditions of salinity, tomato seedlings subjected to a lower R: FR value (0.8) significantly increased both their growth, proline content, chlorophyll content and net photosynthesis rate (Pn), while they decreased malondialdehyde (MDA) compared to the higher R: FR value (7.4). Under conditions of salinity, the lower R: FR value caused a decrease in both the superoxide anion (O2•-) and in hydrogen peroxide (H2O2) generation, an increase in the activities of superoxidase dismutase (SOD, EC 1.15.1.1), peroxidase (POD, EC 1.11.1.7) and catalase (CAT, EC 1.11.1.7). Tomato seedlings grown under the lower R: FR value and conditions of salinity showed a higher actual quantum yield of photosynthesis (ΦPSII), electron transport rate (ETR), and photochemical quenching (qP) than those exposed to a higher R: FR, indicating overall healthier growth. However, the salinity tolerance induced at the lower R: FR condition disappeared in the tomato phyB1 mutant.

Conlusion: These results suggest that growing tomato with a lower R: FR value could improve seedlings' salinity tolerance, and phytochrome B1 play an very important role in this process. Therefore, different qualities of light can be used to efficiently develop abiotic stress tolerance in tomato cultivation.

Keywords: Antioxidant system; Phytochrome B1; R: FR ratio; Tomato; chlorophyll fluorescence.


Conflict of interest statement

Ethics approval and consent to participate

Not applicable.

Competing interests

The authors declare that they have no competing interests.

Publisher’s Note

Springer Nature remains neutral with regard to jurisdictional claims in published maps and institutional affiliations.

Figures

Fig. 1
Fig. 1
Effects of different R: FR values on proline, soluble protein, and MDA content, and relative electrolyte leakage in tomato seedlings under salinity stress. a proline content. b soluble protein content. c MDA content. Proline, soluble protein and MDA contents were measured 0, 2, 4, 6, and 8 days after exposure to the salinity treatment. d relative electrolyte leakage, measured 8 days after salinity treatment. T1, 0 mM NaCl + 7.4 R: FR; T2, 0 mM NaCl + 1.2 R: FR; T3, 0 mM NaCl + 0.8 R: FR; T4, 100 mM NaCl + 7.4 R: FR; T5, 100 mM NaCl + 1.2 R: FR; T6, 100 mM NaCl + 0.8 R: FR. Vertical bars on the lines represent the SE (n = 5), Bars with different letters are significantly different at the 0.05 level (Duncan’s multiple range test)
Fig. 2
Fig. 2
Effects of different R: FR values on on ROS (O2•− and H2O2) and ROS scavenging enzymes (SOD, POD and CAT) activities in tomato seedlings under salinity stress. a O2•− content. b H2O2 content. c SOD activity. d POD activity. e CAT activity.These parameters were measured 0, 2, 4, 6, 8 days after exposure to salinity treatment. T1, 0 mM NaCl + 7.4 R: FR; T2, 0 mM NaCl + 1.2 R: FR; T3, 0 mM NaCl + 0.8 R: FR; T4, 100 mM NaCl + 7.4 R: FR; T5, 100 mM NaCl + 1.2 R: FR; T6, 100 mM NaCl + 0.8 R: FR.Vertical bars on the lines represent the SE (n = 5)
Fig. 3
Fig. 3
Effects of different R: FR values on chlorophyll content, photosynthesis rate, and PSII electron transport in tomato seedlings under salinity stress. a chlorophyll a, chlorophyll b and carotenoid content. b light responsive curve. c net photosynthesis rate. d actual photochemical efficiency of PSII. e electron transport rate. f the photochemical quenching coefficient. Chlorophyll content, the light responsive curve and PSII electron transport parameters were measured eight days after salinity treatment. Net photosynthesis rate was measured 0, 2, 4, 6, and 8 days after exposure to salinity treatment. T1, 0 mM NaCl + 7.4 R: FR; T2, 0 mM NaCl + 1.2 R: FR; T3, 0 mM NaCl + 0.8 R: FR; T4, 100 mM NaCl + 7.4 R: FR; T5, 100 mM NaCl + 1.2 R: FR; T6, 100 mM NaCl + 0.8 R: FR. Vertical bars on the lines represent the SE (n = 5), Bars with different letters are significantly different at the 0.05 level (Duncan’s multiple range test)
Fig. 4
Fig. 4
Effects of different R: FR values on on chlorophyll content, photosynthesis rate, actual photochemical efficiency of PSII, and the content of H2O2, proline and MDA in tomato phyB1 mutants under salinity stress. a chlorophyll a, chlorophyll b and carotenoid content. b net photosynthesis rate. c actual photochemical efficiency of PSII. d H2O2 content. e proline content. f MDA content. All these parameters were measured 8 days after salinity treatment. T1, 0 mM NaCl + 7.4 R: FR; T2, 0 mM NaCl + 1.2 R: FR; T3, 0 mM NaCl + 0.8 R: FR; T4, 100 mM NaCl + 7.4 R: FR; T5, 100 mM NaCl + 1.2 R: FR; T6, 100 mM NaCl + 0.8 R: FR. Vertical bars on the lines represent the SE (n = 5), Bars with different letters are significantly different at the 0.05 level (Duncan’s multiple range test)
Fig. 5
Fig. 5
Spectral distribution characteristics of white and FR LED used for different R: FR treatments. The black curve represents R: FR value is 0.8, the red curves represents R: FR value is 1.2; blue curve represents R: FR value is 7.4

References

    1. Carvalho RF, Takaki M, Azevedo RA. Plant pigments: the many faces of light perception. Acta Physiol Plant. 2011;33(2):241–248. doi: 10.1007/s11738-010-0533-7. - DOI
    1. Franklin KA, Quail PH. Phytochrome functions in Arabidopsis development. J Exp Bot. 2010;61(1):11–24. doi: 10.1093/jxb/erp304. - DOI - PMC - PubMed
    1. Hayes S, Sharma A, Fraser DP, Trevisan M, Cragg-Barber CK, Tavridou E, Fankhauser C, Jenkins GI, Franklin KA. UV-B perceived by the UVR8 photoreceptor inhibits plant thermomorphogenesis. Curr Biol. 2017;27(1):120–127. doi: 10.1016/j.cub.2016.11.004. - DOI - PMC - PubMed
    1. Liu B, Yang Z, Gomez A, Liu B, Lin C, Oka Y. Signaling mechanisms of plant cryptochromes in Arabidopsis thaliana. J Plant Res. 2016;129(2):137–148. doi: 10.1007/s10265-015-0782-z. - DOI - PMC - PubMed
    1. Müller P, Bouly J-P. Searching for the mechanism of signalling by plant photoreceptor cryptochrome. FEBS Lett. 2015;589(2):189–192. doi: 10.1016/j.febslet.2014.12.008. - DOI - PubMed