

Comparing population and incident data for optimal air ambulance base locations in Norway
- PMID: 29793526
- PMCID: PMC5968535
- DOI: 10.1186/s13049-018-0511-4
Comparing population and incident data for optimal air ambulance base locations in Norway
Abstract
Background: Helicopter emergency medical services are important in many health care systems. Norway has a nationwide physician manned air ambulance service servicing a country with large geographical variations in population density and incident frequencies. The aim of the study was to compare optimal air ambulance base locations using both population and incident data.
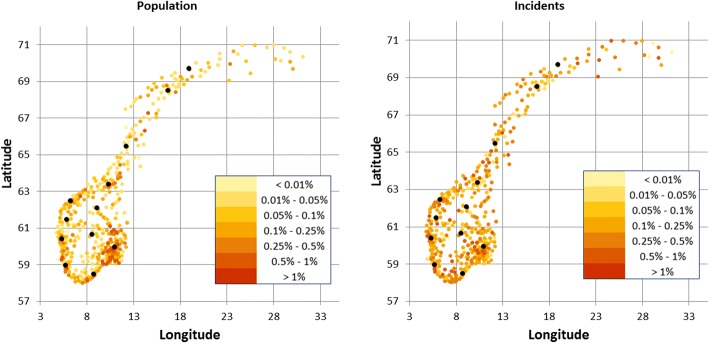
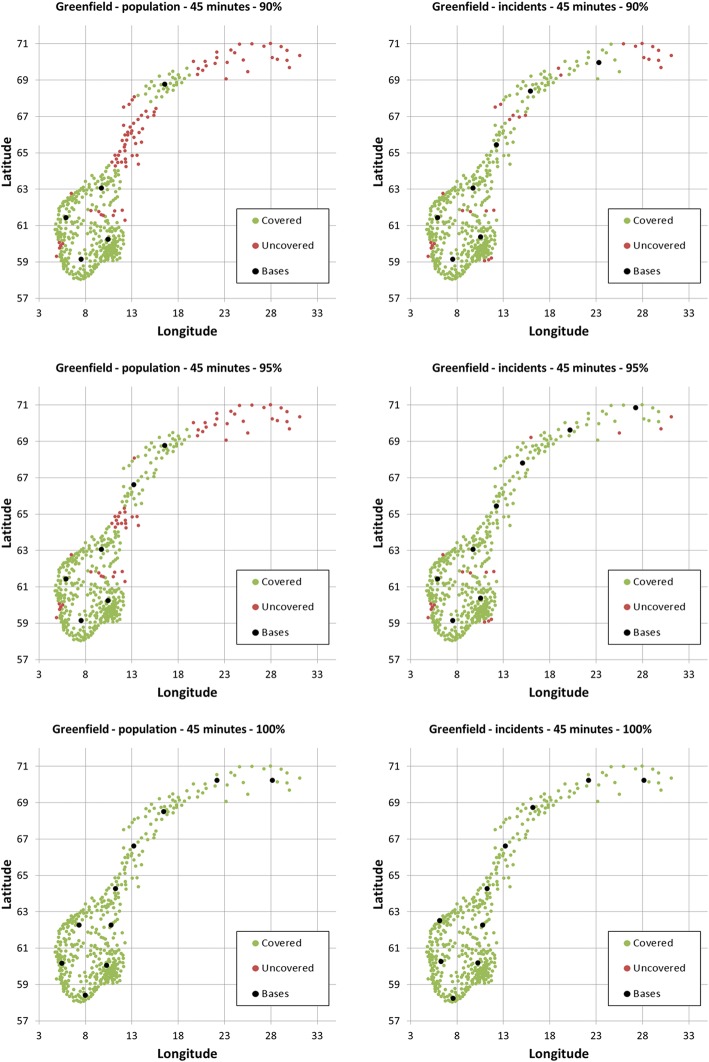
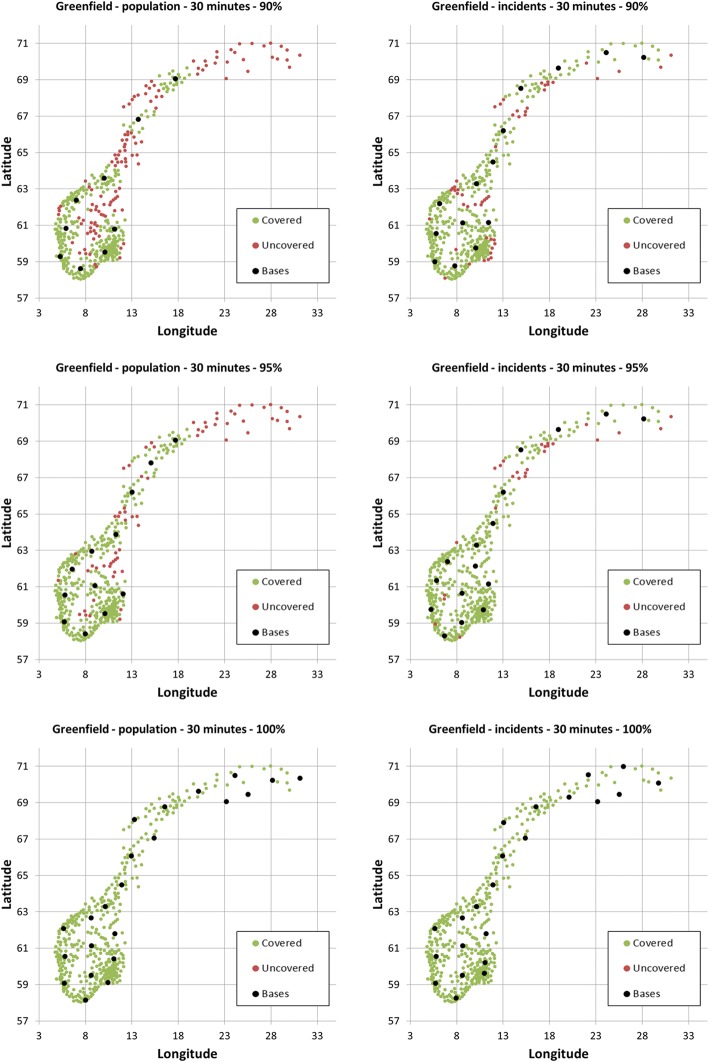
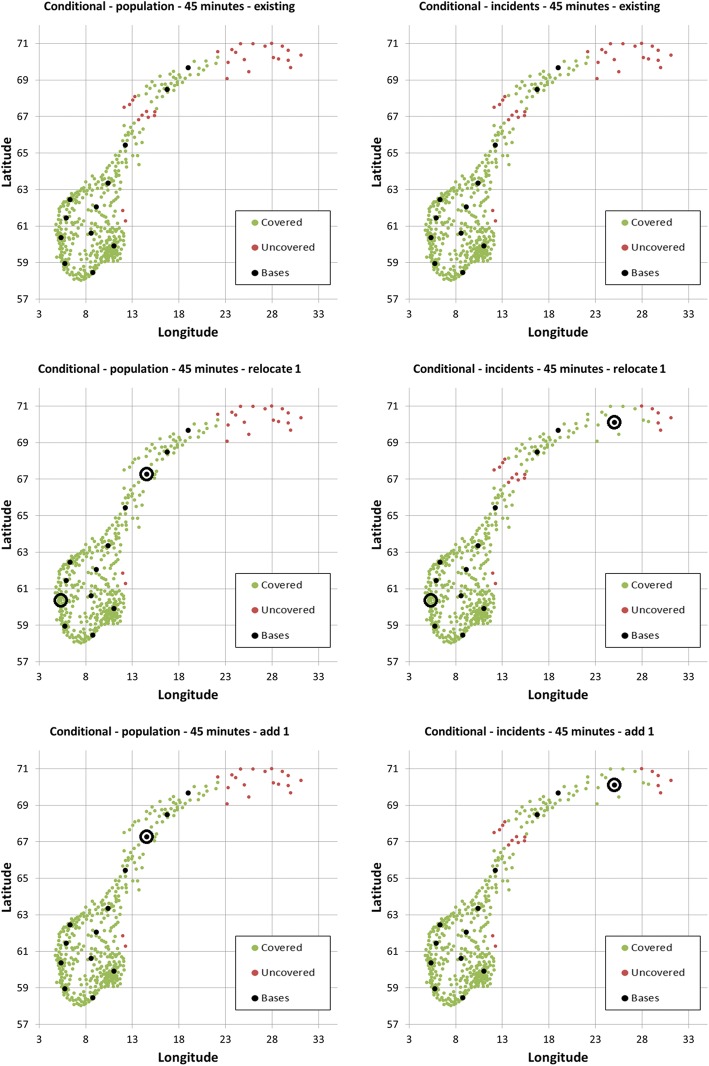
Methods: We used municipality population and incident data for Norway from 2015. The 428 municipalities had a median (5-95 percentile) of 4675 (940-36,264) inhabitants and 10 (2-38) incidents. Optimal helicopter base locations were estimated using the Maximal Covering Location Problem (MCLP) optimization model, exploring the number and location of bases needed to cover various fractions of the population for time thresholds 30 and 45 min, in green field scenarios and conditioned on the existing base structure.
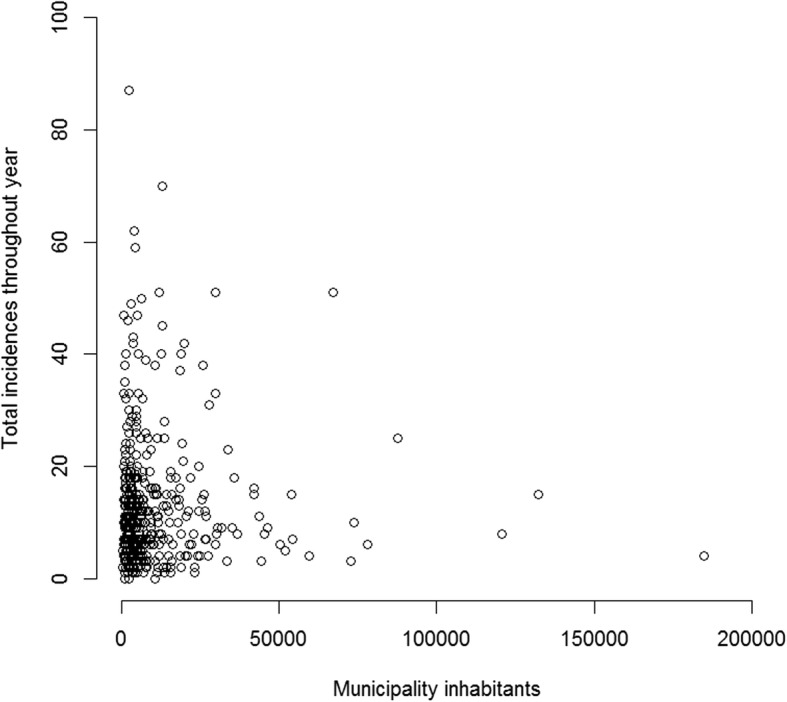
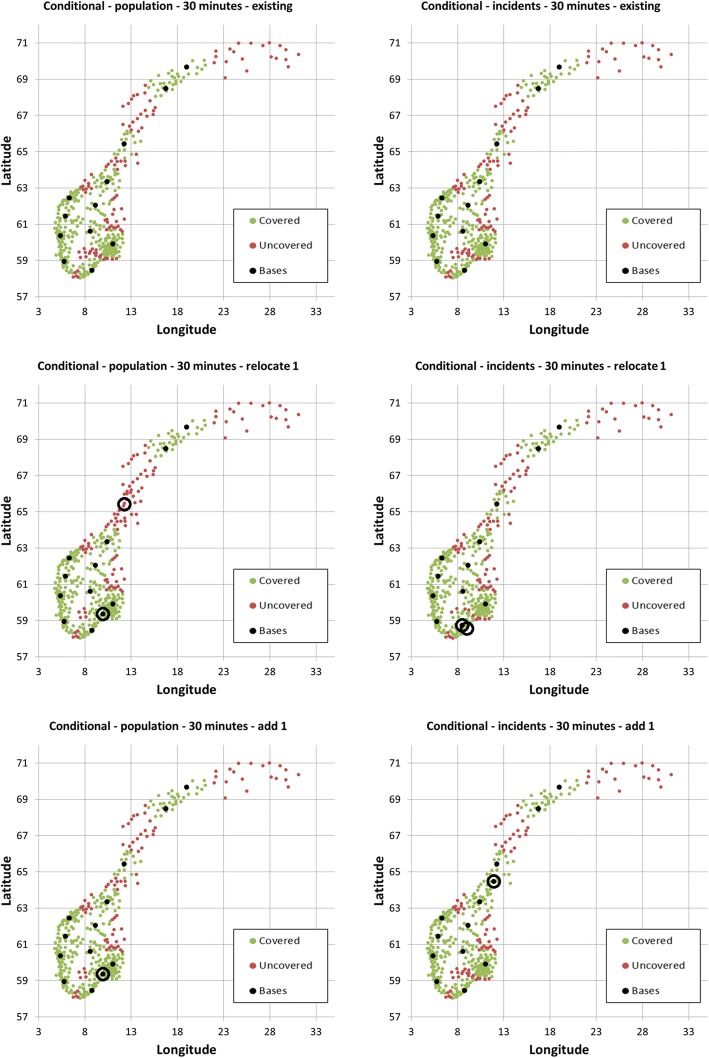
Results: The existing bases covered 96.90% of the population and 91.86% of the incidents for time threshold 45 min. Correlation between municipality population and incident frequencies was -0.0027, and optimal base locations varied markedly between the two data types, particularly when lowering the target time. The optimal solution using population density data put focus on the greater Oslo area, where one third of Norwegians live, while using incident data put focus on low population high incident areas, such as northern Norway and winter sport resorts.
Conclusion: Using population density data as a proxy for incident frequency is not recommended, as the two data types lead to different optimal base locations. Lowering the target time increases the sensitivity to choice of data.
Keywords: Air ambulance; Coverage; Facility location problem; HEMS; Incidents; MCLP; Population density.
Conflict of interest statement
Ethics approval and consent to participate
Not applicable.
Competing interests
The authors declare that they have no competing interests.
Publisher’s Note
Springer Nature remains neutral with regard to jurisdictional claims in published maps and institutional affiliations.
Figures
References
-
- Taylor CB, Stevenson M, Jan S, Liu B, Tall G, Middleton PM, et al. An investigation into the cost, coverage and activities of Helicopter Emergency Medical Services in the state of New South Wales, Australia. Injury. 42(10):1088–94. 10.1016/j.injury.2011.02.013. - PubMed
MeSH terms
LinkOut - more resources
Full Text Sources
Other Literature Sources
