. 2018 Jun 20;38(25):5739-5749.
doi: 10.1523/JNEUROSCI.3382-17.2018. Epub 2018 May 23.

Cortical Oscillatory Mechanisms Supporting the Control of Human Social-Emotional Actions

Affiliations

Cortical Oscillatory Mechanisms Supporting the Control of Human Social-Emotional Actions

Bob Bramson et al. J Neurosci. .

Abstract

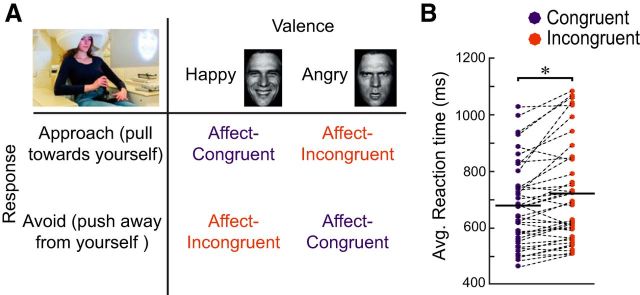
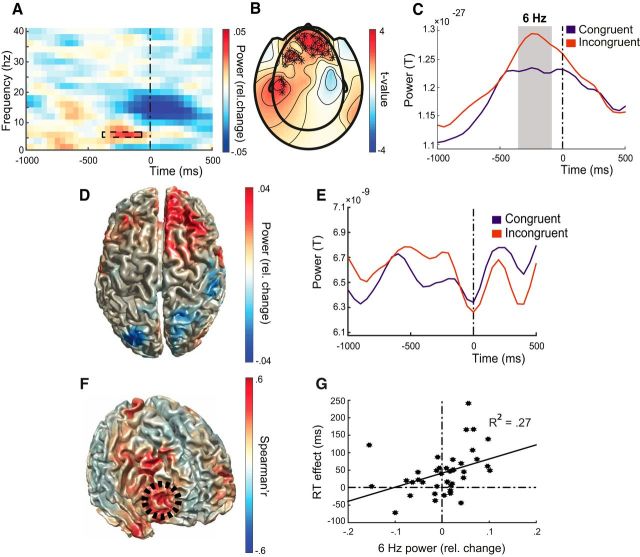
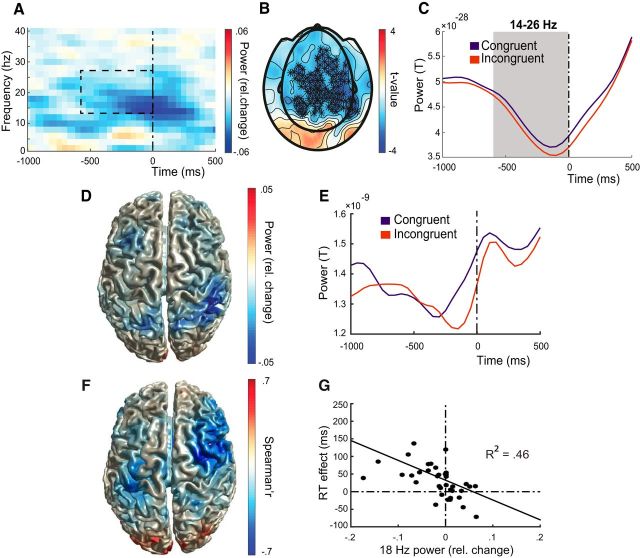
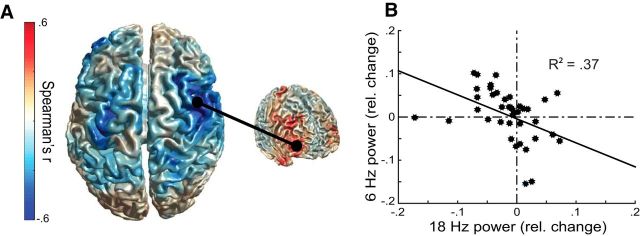
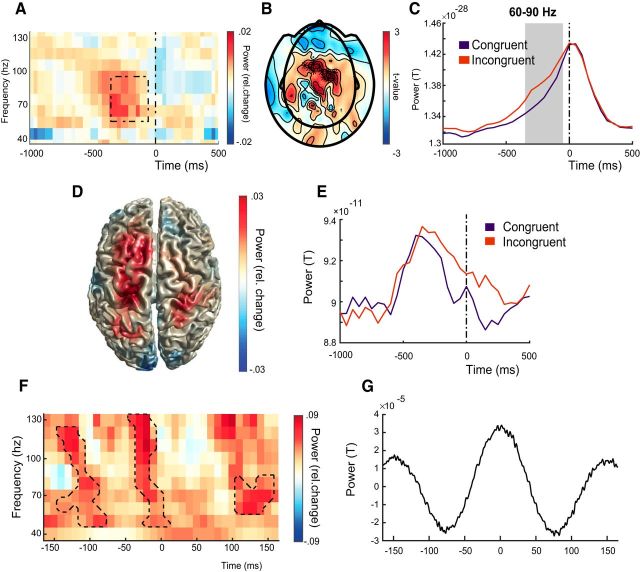
The human anterior prefrontal cortex (aPFC) is involved in regulating social-emotional behavior, presumably by modulating effective connectivity with downstream parietal, limbic, and motor cortices. Regulating that connectivity might rely on theta-band oscillations (4-8 Hz), a brain rhythm known to create overlapping periods of excitability between distant regions by temporally releasing neurons from inhibition. Here, we used MEG to understand how aPFC theta-band oscillations implement control over prepotent social-emotional behaviors; that is, the control over automatically elicited approach and avoidance actions. Forty human male participants performed a social approach-avoidance task in which they approached or avoided visually displayed emotional faces (happy or angry) by pulling or pushing a joystick. Approaching angry and avoiding happy faces (incongruent condition) requires rapid application of cognitive control to override prepotent habitual action tendencies to approach appetitive and to avoid aversive situations. In the time window before response delivery, trial-by-trial variations in aPFC theta-band power (6 Hz) predicted reaction time increases during emotional control and were inversely related to beta-band power (14-22 Hz) over parietofrontal cortex. In sensorimotor areas contralateral to the moving hand, premovement gamma-band rhythms (60-90 Hz) were stronger during incongruent than congruent trials, with power increases phase locked to peaks of the aPFC theta-band oscillations. These findings define a mechanistic relation between cortical areas involved in implementing rapid control over human social-emotional behavior. The aPFC may bias neural processing toward rule-driven actions and away from automatic emotional tendencies by coordinating tonic disinhibition and phasic enhancement of parietofrontal circuits involved in action selection.SIGNIFICANCE STATEMENT Being able to control social-emotional behavior is crucial for successful participation in society, as is illustrated by the severe social and occupational difficulties experienced by people suffering from social motivational disorders such as social anxiety. In this study, we show that theta-band oscillations in the anterior prefrontal cortex (aPFC), which are thought to provide temporal organization for neural firing during communication between distant brain areas, facilitate this control by linking aPFC to parietofrontal beta-band and sensorimotor gamma-band oscillations involved in action selection. These results contribute to a mechanistic understanding of cognitive control over automatic social-emotional action and point to frontal theta-band oscillations as a possible target of rhythmic neurostimulation techniques during treatment for social anxiety.

Keywords: MEG; approach–avoidance; frontal pole; phase-amplitude coupling; social–emotional control; theta-band oscillations.


Figures

Figure 1.
Figure 1.
AA task and behavioral results. A, Schematic representation of the affect-congruent and affect-incongruent conditions in the AA task. B, Average reaction times for each participant (n = 40) and condition. Responses are slower during incongruent trials. *t(39) = −4.33, p < 0.001.
Figure 2.
Figure 2.
Emotional control increases theta-band power in aPFC. A, Time–frequency plot of between conditions power differences (congruency effect: incongruent − congruent/congruent + incongruent) averaged over sensors with a significant effect (see B). Time 0: response onset. The dashed box shows the time–frequency interval with a significant congruency effect (−350 to −100 ms before response; 6 Hz). B, Topographic distribution of sensors with a significant congruency effect at 6 Hz (stars). C, Changes over time in theta-band power (6 Hz) averaged across significant sensors (see B). The epoch with a significant difference between conditions is marked in gray. D, Cortical distribution of theta-band congruency effects. E, Time series of 6 Hz activity extracted from right frontal pole/superior frontal gyrus (20 40 50). F, Cortical distribution of correlations between theta-band and behavioral congruency effects, with a significant cluster over aPFC (dashed black circle, MNI coordinates of local maximum: 40 48 −6). G, Correlation between theta-band and behavioral congruency effects. Black dots represent measurements from each participant. Theta-band power changes are extracted from the local maximum in aPFC.
Figure 3.
Figure 3.
Emotional control decreases beta-band power in parietal and frontal cortex. A, Time–frequency plot of between conditions power differences (congruency effect: incongruent − congruent/congruent + incongruent) averaged over sensors with a significant effect (see B). Time 0: response onset. The dashed box shows the time–frequency interval with a significant congruency effect (−600 to 0 ms before response; 14–26 Hz). B, Topographic distribution of sensors with a significant congruency effect at 14–26 Hz (stars). C, changes over time in beta-band power (14–26 Hz) averaged across significant sensors (see B). The epoch with a significant difference between conditions is marked in gray. D, Cortical distribution of beta-band congruency effects (center frequency, 18 Hz). E, Time series of 18 Hz activity extracted from superior parietal lobule (44 −40 56). F, Cortical distribution of correlations between beta-band (18 Hz) and behavioral congruency effects, with a significant cluster over right precentral gyrus (MNI coordinates of local maximum: 48 −2 36). G, Correlation between beta-band and behavioral congruency effects. Black dots represent measurements from each participant. Beta-band power changes are extracted from the right precentral maximum.
Figure 4.
Figure 4.
Emotional control increases connectivity between aPFC and frontoparietal areas. A, Cortical distribution (uncorrected for multiple comparisons) of correlations between beta-band congruency effects and theta-band congruency effects extracted from aPFC (in red, from Fig. 2E). The cluster over the right precentral gyrus (MNI coordinates of local maximum: 50 −10 36) is significant. B, Correlation between aPFC theta-band and precentral beta-band congruency effects. Black dots represent measurements from each participant. Beta-band power changes are extracted from the right precentral maximum.
Figure 5.
Figure 5.
Emotional control increases gamma-band power in parietal and frontal cortex during peaks of theta-band oscillations in aPFC. A, Time–frequency plot of between conditions power differences (congruency effect: incongruent − congruent/congruent + incongruent) averaged over sensors with a significant effect (see B). Time 0: response onset. The dashed box shows the time–frequency interval with a significant congruency effect (−350 to −50 ms before response; 60–90 Hz). B, Topographic distribution of sensors with a significant congruency effect at 60–90 Hz (stars). C, Changes over time in gamma-band power (60–90 Hz) averaged across significant sensors (see B). D, Cortical distribution of relative gamma-band congruency effects, with a significant cluster around the left central sulcus (−28 −32 64). E, Time series of 60–90 Hz activity extracted from left central sulcus (−28 −32 64). F, Time–frequency plot of gamma-band power congruency effects extracted from the local maximum in the left central sulcus (F) phase-locked to the aPFC theta-band signal before response. Contours are drawn around significant clusters where power is stronger in incongruent versus congruent trials. G, Event-related field of the theta-band signal extracted from aPFC.

Similar articles

Cited by

References

    1. Adhikari A, Topiwala MA, Gordon JA (2010) Synchronized activity between the ventral hippocampus and the medial prefrontal cortex during anxiety. Neuron 65:257–269. 10.1016/j.neuron.2009.12.002 - DOI - PMC - PubMed
    1. Ardid S, Vinck M, Kaping D, Marquez S, Everling S, Womelsdorf T (2015) Mapping of functionally characterized cell classes onto canonical circuit operations in primate prefrontal cortex. J Neurosci 35:2975–2991. 10.1523/JNEUROSCI.2700-14.2015 - DOI - PMC - PubMed
    1. Aron AR, Robbins TW, Poldrack RA (2014) Inhibition and the right inferior frontal cortex: one decade on. Trends Cogn Sci 18:177–185. 10.1016/j.tics.2013.12.003 - DOI - PubMed
    1. Aru J, Aru J, Priesemann V, Wibral M, Lana L, Pipa G, Singer W, Vicente R (2015) Untangling cross-frequency coupling in neuroscience. Curr Opin Neurobiol 31:51–61. 10.1016/j.conb.2014.08.002 - DOI - PubMed
    1. Badre D, D'Esposito M (2009) Is the rostro-caudal axis of the frontal lobe hierarchical? Nat Rev Neurosci 10:659–669. 10.1038/nrn2667 - DOI - PMC - PubMed

Publication types

LinkOut - more resources