Simultaneous radiation of bird and mammal lice following the K-Pg boundary
- PMID: 29794007
- PMCID: PMC6012693
- DOI: 10.1098/rsbl.2018.0141
Simultaneous radiation of bird and mammal lice following the K-Pg boundary
Abstract
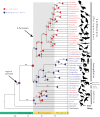
The diversification of parasite groups often occurs at the same time as the diversification of their hosts. However, most studies demonstrating this concordance only examine single host-parasite groups. Multiple diverse lineages of ectoparasitic lice occur across both birds and mammals. Here, we describe the evolutionary history of lice based on analyses of 1107 single-copy orthologous genes from sequenced genomes of 46 species of lice. We identify three major diverse groups of lice: one exclusively on mammals, one almost exclusively on birds and one on both birds and mammals. Each of these groups radiated just after the Cretaceous-Paleogene (K-Pg) boundary, the time of the mass extinction event of the dinosaurs and rapid diversification of most of the modern lineages of birds and mammals.
Keywords: Phthiraptera; coevolution; host–parasite interactions; phylogenomics; systematics.
© 2018 The Author(s).
Conflict of interest statement
We declare we have no competing interests.
Figures

References
-
- Erhlich PR, Raven PH. 1964. Butterflies and plants: a study in coevolution. Evolution 18, 586–608. (10.1111/j.1558-5646.1964.tb01674.x) - DOI
-
- Grimaldi D, Engel MS. 2005. Evolution of the insects. New York, NY: Cambridge University Press.
Publication types
MeSH terms
Associated data
LinkOut - more resources
Full Text Sources
Other Literature Sources

