. 2018 Aug 6;217(8):2691-2708.
doi: 10.1083/jcb.201802138. Epub 2018 May 23.

Microtubules grow by the addition of bent guanosine triphosphate tubulin to the tips of curved protofilaments

Affiliations

Microtubules grow by the addition of bent guanosine triphosphate tubulin to the tips of curved protofilaments

J Richard McIntosh et al. J Cell Biol. .

Abstract

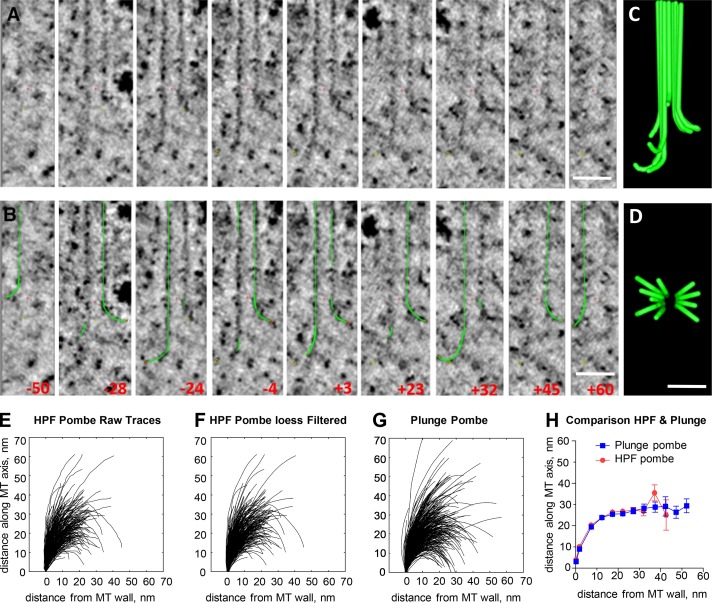
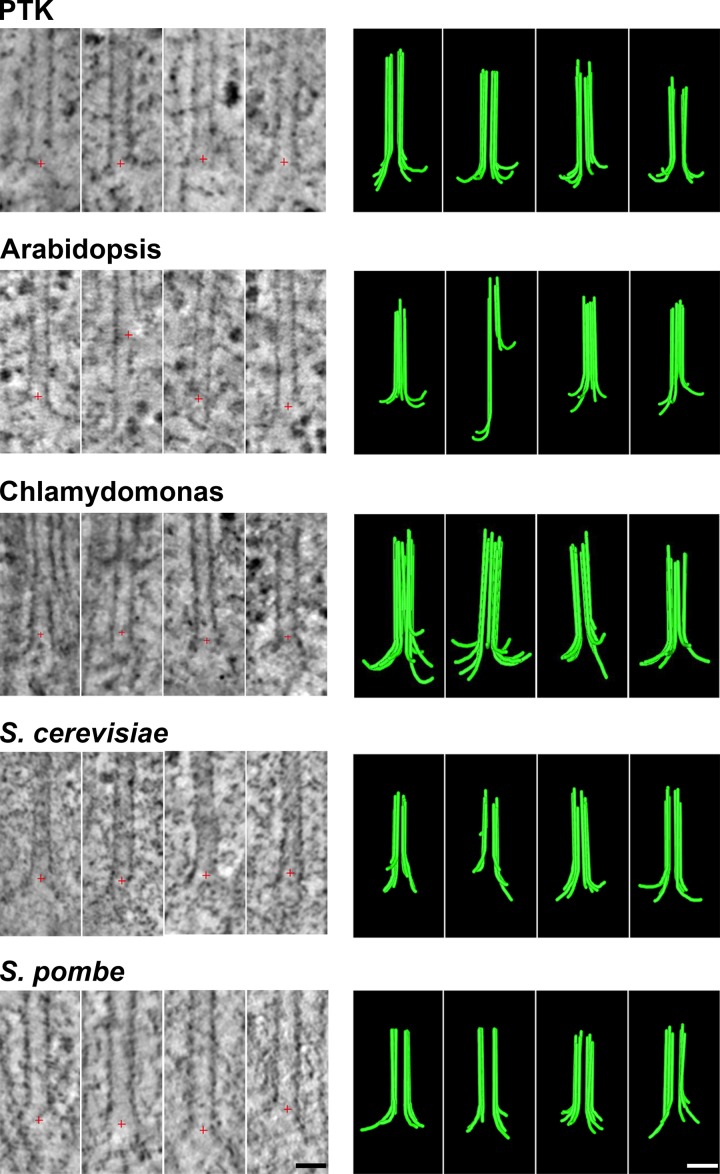
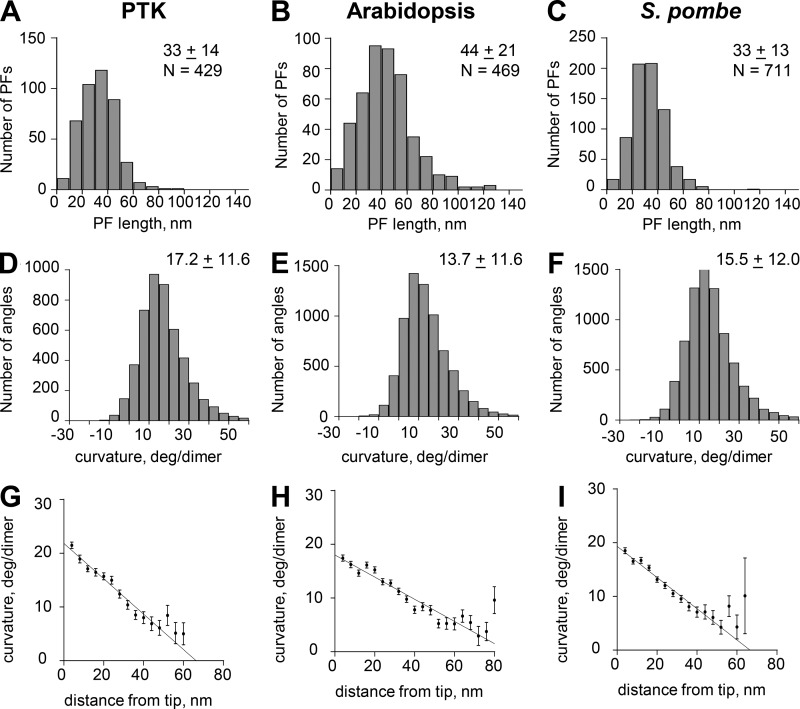
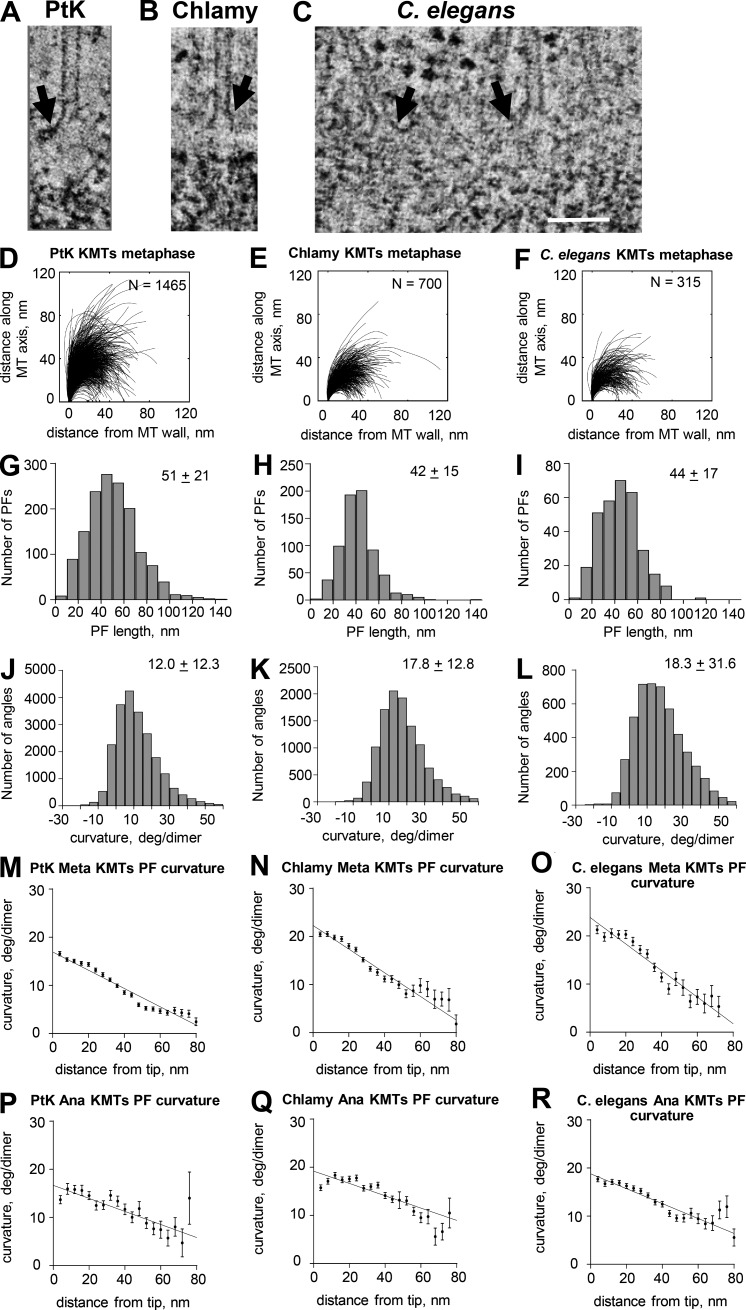
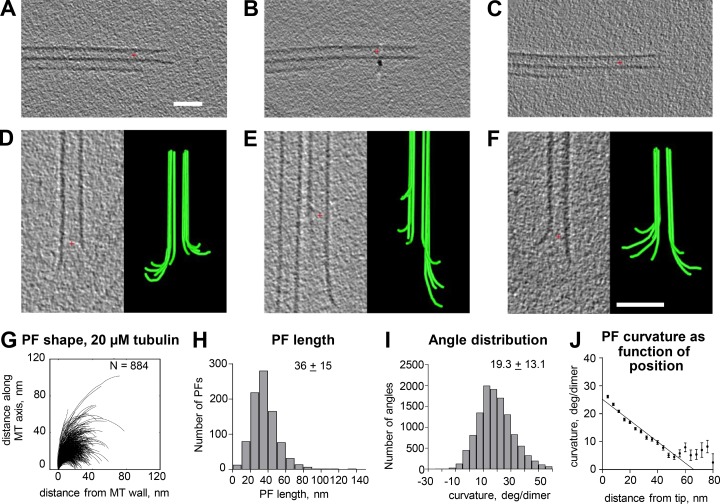
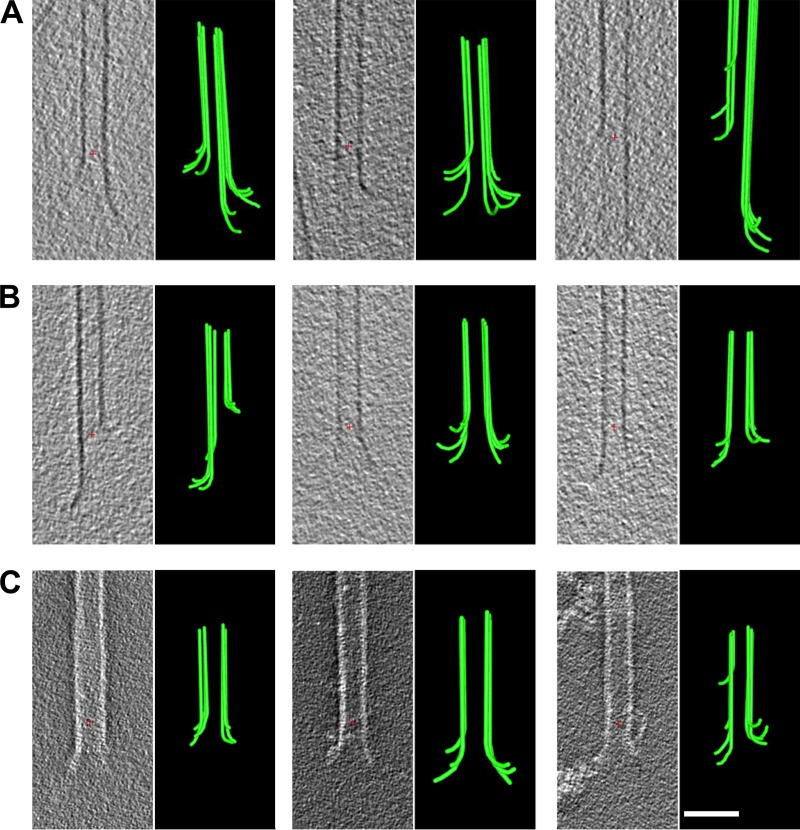
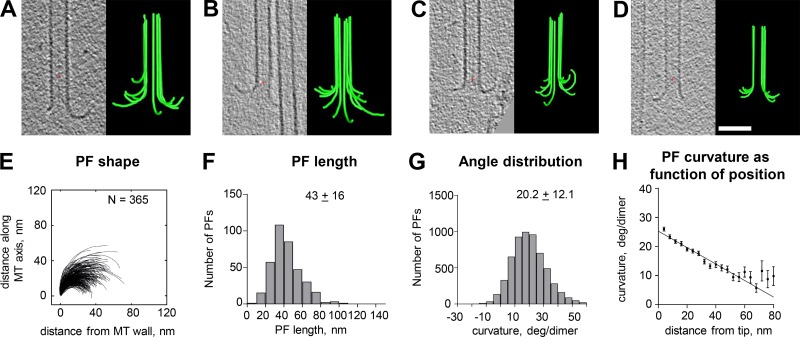
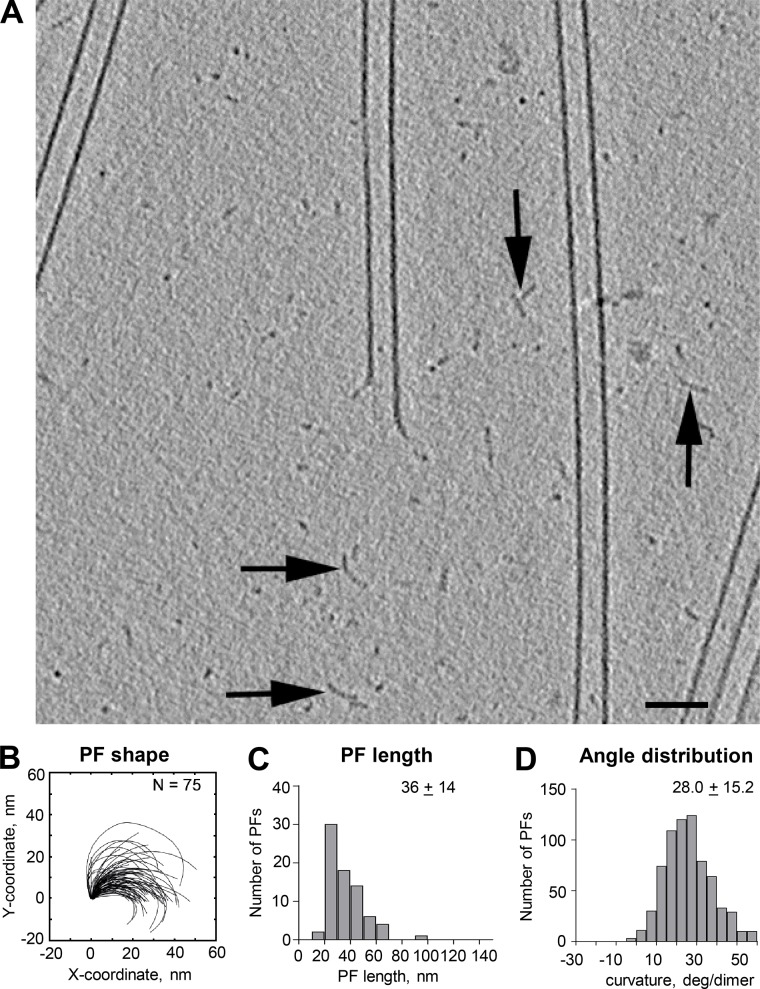
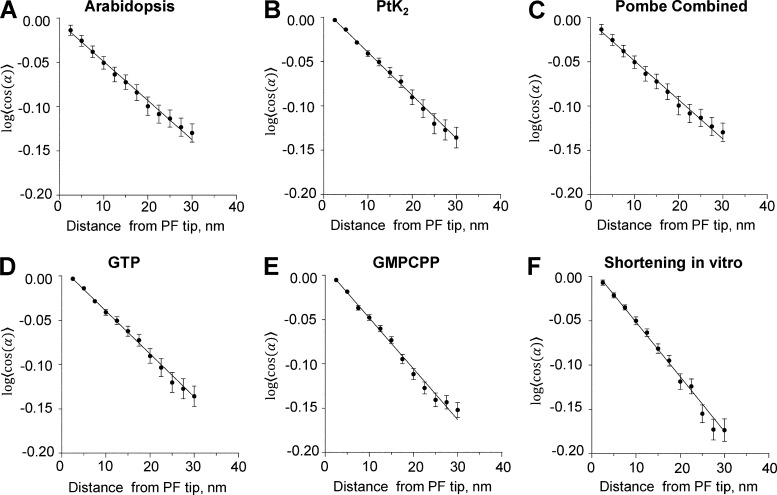
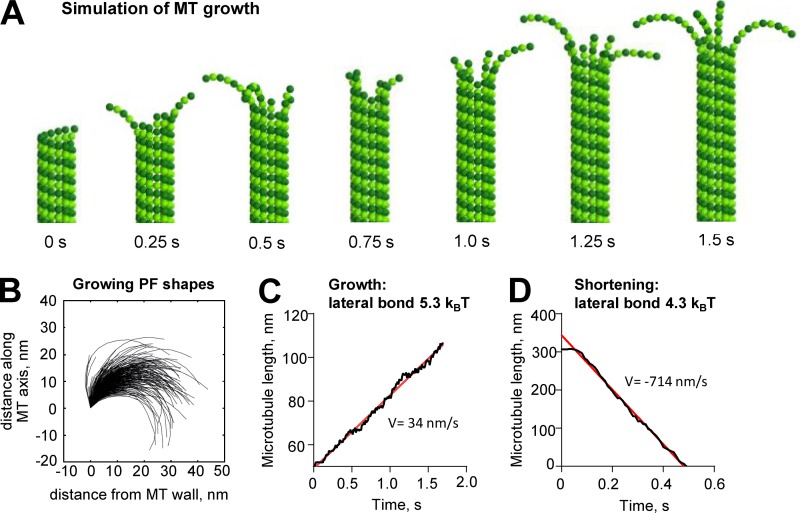
We used electron tomography to examine microtubules (MTs) growing from pure tubulin in vitro as well as two classes of MTs growing in cells from six species. The tips of all these growing MTs display bent protofilaments (PFs) that curve away from the MT axis, in contrast with previously reported MTs growing in vitro whose tips are either blunt or sheetlike. Neither high pressure nor freezing is responsible for the PF curvatures we see. The curvatures of PFs on growing and shortening MTs are similar; all are most curved at their tips, suggesting that guanosine triphosphate-tubulin in solution is bent and must straighten to be incorporated into the MT wall. Variations in curvature suggest that PFs are flexible in their plane of bending but rigid to bending out of that plane. Modeling by Brownian dynamics suggests that PF straightening for MT growth can be achieved by thermal motions, providing a simple mechanism with which to understand tubulin polymerization.


Figures

Figure 1.
Figure 1.
Angular sampling of the 3D structure of a growing MT end. (A) Nine slices through the end of an MT from the anaphase B interzone in a PtK2 cell. All images contain the MT axis, but the orientation of the plane of sampling the 3D volume was changed to display flaring PFs. Red crosses mark the origins of the coordinate systems used. (B) The same images showing the angles at which the slices were taken and graphic objects drawn by hand on the image data. Red x's mark the tips of the graphic traces that represent the PFs. (C and D) Two orthogonal views of the graphic objects drawn on this MT end. Bars, 50 nm. (E) 346 PFs traced on the plus ends of 42 elongating IPMTs from four S. pombe (Pombe) cells in anaphase B that were cryoimmobilized by high-pressure freezing (HPF) and then prepared for EM. (F) The same traces after smoothing with a quadratic LOESS filter. (G) LOESS-filtered traces from 399 PFs from the plus ends of 45 IPMTs identified in four anaphase S. pombe cells cryoimmobilized by plunge freezing and then prepared for EM. (H) Means and SEMs for positions traced along all PFs from these two datasets to compare mean PF shapes after two methods of freezing.
Figure 2.
Figure 2.
Images and models of MTs growing in vivo. For each of five species names, the left column displays tomographic slices that contain the MT axis and show one or more PFs flaring out from the MT wall. Red crosses mark the origin of the coordinate system used for rotational sampling of the PFs. The right column displays models of these same MT ends showing traces of all the PFs detected by rotational sampling of the MT end as in Fig. 1 and Videos 1, 2, 3, 4, and 5. Bars, 25 nm.
Figure 3.
Figure 3.
Graphs depicting aspects of PF shape from three of the species studied. (A–C) Distributions of lengths for PFs from the species indicated. N, numbers of PFs traced. Other values are mean lengths ± SD. (D–F) Distributions of angles between consecutive line segments that connect adjacent points along all tracings for all PFs of each species shown. N, numbers of angles. Other values are means ± SD. (G–I) Distributions of mean angles between consecutive line segments plotted as functions of distance from the PF tip for each of the species studied. Error bars are SEM.
Figure 4.
Figure 4.
Pictures and graphs describing the plus ends of metaphase KMTs. (A–C) Slices from tomograms of the plus ends of metaphase KMTs from the three species named. Arrows indicate flaring PFs. Bar, 100 nm. (D–F) Smoothed traces of PFs drawn on metaphase KMTs from each species. N, numbers traced. (G–I) Distributions of PF lengths. (J–L) Distributions of angles between adjacent line segments along PFs. Numbers are means ± SD. (M–O) Means and SEM of angles between adjacent segments along PFs plotted as a function of distance from the PF tips. (P–R) Similar graphs for PF from anaphase KMTs from the same species. Chlamy, Chlamydomonas.
Figure 5.
Figure 5.
Shapes of plus ends of MTs elongating in vitro. (A–C) Slices through tomograms of three examples of the axonemal doublet MTs that served as seeds to nucleate the polymerization of purified porcine brain tubulin. (D–F) Tomographic slices and models of three representative MTs elongating from axonemal doublet MTs. Many of the PFs curve outward from the MT axis. Red crosses mark the origins of the coordinate systems used. Bars, 50 nm. (G) LOESS-smoothed traces of PFs from 60 growing MTs. N, numbers traced. (H and I) Distributions of lengths and angles for the PFs in G. (J) Means and SEM of angles between adjacent segments along PFs plotted as a function of distance from the PF tips.
Figure 6.
Figure 6.
Shapes of plus ends of in vitro MTs elongating or prepared under stabilizing conditions. (A) Tomographic slices and models of MT ends plunge frozen while elongating in GMPCPP. (B) Tomographic slices and models of MTs fixed isothermally in first 0.2% and then 2% glutaraldehyde before plunge freezing. (C) Tomographic slices and models of MTs fixed isothermally in first 0.2% and then 2% glutaraldehyde and then negatively strained with uranyl acetate. Red crosses mark the origins of the coordinate systems used. Bar, 50 nm.
Figure 7.
Figure 7.
Shapes of plus ends of MTs shortening in vitro. (A–D) Tomographic slices and models showing flaring PFs of MTs frozen ∼20 s after isothermal dilution. Red crosses mark the origins of the coordinate systems used. Bar, 50 nm. (E) Traces of PFs on shortening MTs. (F–H) Graphs showing distributions of lengths, angles, and angles as a function of distance from the PF tips. Numbers and bars are as in Fig. 5. N, numbers traced. Error bars show SEM.
Figure 8.
Figure 8.
Oligomers formed during tubulin polymerization. (A) 20-nm slice from a cryotomogram of an MT elongating in 20 µM tubulin for 6 min before plunge freezing. A large enough area of background is shown to reveal structures that we interpret as oligomers of tubulin (arrows) lying between the elongating MTs. Bar, 50 nm. (B–D) Tracings of these structures and distributions of their lengths and curvatures. N, numbers traced.
Figure 9.
Figure 9.
Data describing PF flexibility. (A–F) Plots of the logarithms of the cosines of mean differences between each measured angle between adjacent line segments and the means of all angles at that distance from the PF tip for each species listed. Error bars are SEM. Assuming thermal equilibrium, these data yield measures of persistence lengths as stated in Table 4. Pombe, S. pombe.
Figure 10.
Figure 10.
MT growth with curved PFs illustrated with a Brownian dynamics model. (A) MT growth in a model with curved GTP-tubulin. (B) Shapes of simulated PFs on the growing MT tip. (C) Dependence of MT length on time in simulation with lateral bond 5.3 kBT yielding the polymerization rate V = 34 nm/s. Data in A–C correspond with Video 5. (D) Dependence of MT length on time in simulation with lateral bond 4.3 kBT yielding the depolymerization rate v = 714 nm/s. Note that initial pause before rapid MT shortening is caused by the start of the simulation from the metastable configuration with blunt end. The pause was excluded from the linear fit. Red lines are linear fits to data.

Comment in

References

    1. Akhmanova A., and Steinmetz M.O.. 2015. Control of microtubule organization and dynamics: two ends in the limelight. Nat. Rev. Mol. Cell Biol. 16:711–726. 10.1038/nrm4084 - DOI - PubMed
    1. Atherton J., Jiang K., Stangier M.M., Luo Y., Hua S., Houben K., van Hooff J.J.E., Joseph A.-P., Scarabelli G., Grant B.J., et al. . 2017. A structural model for microtubule minus-end recognition and protection by CAMSAP proteins. Nat. Struct. Mol. Biol. 24:931–943. 10.1038/nsmb.3483 - DOI - PMC - PubMed
    1. Austin J.R., Segui-Simarro J.M., and Staehelin L.A.. 2005. Quantitative analysis of changes in spatial distribution and plus-end geometry of microtubules involved in plant-cell cytokinesis. J. Cell Sci. 118:3895–3903. 10.1242/jcs.02512 - DOI - PubMed
    1. Brouhard G.J., and Rice L.M.. 2014. The contribution of αβ-tubulin curvature to microtubule dynamics. J. Cell Biol. 207:323–334. 10.1083/jcb.201407095 - DOI - PMC - PubMed
    1. Buey R.M., Díaz J.F., and Andreu J.M.. 2006. The nucleotide switch of tubulin and microtubule assembly: a polymerization-driven structural change. Biochemistry. 45:5933–5938. 10.1021/bi060334m - DOI - PubMed

Publication types

MeSH terms