. 2018 Aug;59(8):1536-1545.
doi: 10.1194/jlr.D084525. Epub 2018 May 23.

Deep phenotyping in zebrafish reveals genetic and diet-induced adiposity changes that may inform disease risk

Affiliations

Deep phenotyping in zebrafish reveals genetic and diet-induced adiposity changes that may inform disease risk

James E N Minchin et al. J Lipid Res. 2018 Aug.

Abstract

The regional distribution of adipose tissues is implicated in a wide range of diseases. For example, proportional increases in visceral adipose tissue increase the risk for insulin resistance, diabetes, and CVD. Zebrafish offer a tractable model system by which to obtain unbiased and quantitative phenotypic information on regional adiposity, and deep phenotyping can explore complex disease-related adiposity traits. To facilitate deep phenotyping of zebrafish adiposity traits, we used pairwise correlations between 67 adiposity traits to generate stage-specific adiposity profiles that describe changing adiposity patterns and relationships during growth. Linear discriminant analysis classified individual fish according to an adiposity profile with 87.5% accuracy. Deep phenotyping of eight previously uncharacterized zebrafish mutants identified neuropilin 2b as a novel gene that alters adipose distribution. When we applied deep phenotyping to identify changes in adiposity during diet manipulations, zebrafish that underwent food restriction and refeeding had widespread adiposity changes when compared with continuously fed, equivalently sized control animals. In particular, internal adipose tissues (e.g., visceral adipose) exhibited a reduced capacity to replenish lipid following food restriction. Together, these results in zebrafish establish a new deep phenotyping technique as an unbiased and quantitative method to help uncover new relationships between genotype, diet, and adiposity.

Keywords: adipose tissue; fat distribution; obesity.


Figures

Fig. 1.
Fig. 1.
Generation of stage-specific adiposity profiles in zebrafish. A: Fluorescence stereomicroscope images of Nile Red-stained zebrafish at two distinct postembryonic stages [pelvic fin ray appearance (PR) and SA]. Note the increasingly complex and diversifying distribution patterns of AT in SA fish relative to PR. White arrows correspond to posterior dorsal SAT (pDSAT), black arrowheads correspond to central paraosseal (cPOS), and white arrowheads correspond to anal fin ray SAT (AFRSAT) Scale bars are 1 mm. B: To determine WT adiposity dynamics, 67 adiposity traits were measured in 456 WT zebrafish. PB is from Parichy et al. (18). Each stage consisted of >10 fish. For each stage, intertrait correlations were determined and used to create an adiposity profile that encapsulates relationship dynamics of individual ATs. C: Example intertrait correlations are given for PVAT and demonstrate the changing relationship between PVAT and SL across distinct stages.
Fig. 2.
Fig. 2.
LDA can be used to identify and classify phenotypic fish based on adiposity profiles. A: LDA was used as a training set to classify 456 WT fish according to stage-specific adiposity profiles. From this training set, LDA was able to accurately classify fish based on adiposity profiles in 87.5% of instances. B: Zebrafish homozygous for the ghwp22e1 mutation have increased total AT (dotted outlines delineate AT). C: Quantification of total AT area in WT sibling and gh mutants. *** P < 0.0001 (Student’s t-test). D: Schematic detailing how the LDA was used to analyze gh mutant and WT sibling fish relative to the training set. E: Of the 122 gh and WT sibling fish, LDA detected 36% as phenotypic (all). The WT sibling fish were not classified as phenotypic relative to baseline classification from the training set (WT). The gh homozygous mutant fish were classified as phenotypic in 60% of instances.
Fig. 3.
Fig. 3.
LDA can be used as a screening tool to identify mutants with adiposity phenotypes in zebrafish. A: LDA misclassification rates (percent phenotypic fish) for the eight ZMP mutants, gh mutants (positive control), and the WT training set. Error bars denote the SEM across multiple clutches. Bars without error bars are from single clutches. Details of the alleles for each mutant line can be found in Table 1. B: Fluorescence stereomicroscope images of Nile Red-stained WT sibling and two nrp2bsa18942 homozygous mutant zebrafish. Note the reduced adiposity levels in nrp2bsa18942 mutants. C: Two additional independent clutches of WT siblings and nrp2bsa18942 mutants were assessed to validate the nrp2b phenotype. Linear regression (straight lines with 95% CIs noted) was used to evaluate adiposity relative to SL, and ANCOVA was used to test for differences between the groups. F1,83 = 52.4, P < 0.0001.
Fig. 4.
Fig. 4.
Food restriction and subsequent refeeding leads to changes in adipose distribution. A: Fluorescence stereomicroscope images of Nile Red-stained zebrafish reveal the mobilization and reduction of lipid within AT during 11 days of food restriction (magenta; days 1–11) and the redeposition and increase in lipid within adipose during 11 days of refeeding (blue; days 12–22). Scale bars are 1 mm. B: PCA of adiposity traits during food restriction and refeeding reveals that food restriction leads to altered adipose distribution. Note that fed fish (light magenta; day 1) do not colocalize with refed animals (dark blue; day 22). C: PCA of food restriction and refeeding reveals the daily changes in adipose distribution.
Fig. 5.
Fig. 5.
LDA can be used to classify food restriction-induced changes in adiposity. A: Chart showing the reduction and subsequent regain of total AT area during food restriction (days 1–11) and refeeding (days 12–22). Black line connects the mean total AT area at each day. Black error bars at each day denote the SD in total AT area. Gray lines indicate the total AT area of individual fish. Red bars indicate the SD of total AT area of size-matched fed animals. Note that at day 22, refed animals have regained total AT to an equivalent level as size-matched continuously fed animals. B: Adiposity profiles showing intertrait correlations at stage DFRSAT in food-restricted/refed animals and size-matched continuously fed animals. C: LDA classifies food-restricted/refed animals as phenotypic in 90% of instances.
Fig. 6.
Fig. 6.
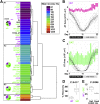
IATs have a decreased capacity to replenish lipid stores following food restriction. A: Hierarchical clustering of individual ATs based on percent replenishment of lipid (day 22 lipid as a percent of day 1 lipid). Four clusters were identified (nos. 1–4) and ranked according to replenishment rates. Color-code indicates percent lipid replenishment (purple/blue, low; green/red, high). IATs are colored magenta. SAT are colored green, and non-AT measures (e.g., SL) are colored black. Pie charts depict the proportion of AT types in each cluster. Note that clusters that replenish lipid to a high degree (i.e., clusters 3 and 4) are increasingly composed of SATs. B, C: AT-lipid mobilization and replenishment dynamics over the course of food-restriction (days 1–11) and refeeding (days 12–22). The black line links mean AT area values at each timepoint. The black error bars denote SD around the mean at each timepoint. The gray lines denote each individual fish (N = 10). The red (IAT; B) or green (SAT; C) bars denote the SD around the mean of size and stage-matched continuously fed WT fish. These bars represent the expected IAT and SAT quantities in normal fish. Note that IAT after food restriction and refeeding does not recover to expected WT levels. D: The percent recovery of IAT and SAT reveals significant differences between the distinct AT divisions. E: The IAT:SAT ratio is significantly reduced in food-restricted and refed animals (day 22) when compared with size and stage-matched continuously fed fish. aCVAT, anterior CVAT; aDSAT, anterior dorsal SAT; AFCSAT, anal fin ray cluster SAT; APPSAT, appendicular SAT; ASAT, abdominal SAT; AVAT, abdominal VAT; BA, body area; BHD, branchihyal; CFRSAT, caudal fin ray SAT; CHD, ceratohyal; cPOS, central paraosseal; CSAT, cranial SAT; dOPC, dorsal oligodendrocyte progenitor cell; dPOS, dorsal paraosseal; DSAT, dorsal SAT; Food res., food-restricted and refed animals; HYD, hyal; IM, intermuscular; LPECSAT, ‘loose’ PECSAT; LSAT, lateral SAT; NVAT, nonvisceral AT; OCU, ocular; OPC, opercular; pCVAT, posterior CVAT; PECSAT, pectoral SAT; PELSAT, pelvic fin SAT; POS, paraosseal; pPECSAT, posterior pectoral SAT; RVAT, renal VAT; TSAT, truncal SAT; UHD, urihyal; vOPC, ventral opercular; vPOS, ventral paraosseal; VSAT, ventral SAT.

References

    1. Gadde K. M., Martin C. K., Berthoud H. R., and Heymsfield S. B.. 2018. Obesity: pathophysiology and management. J. Am. Coll. Cardiol. 71: 69–84. - PMC - PubMed
    1. Fox C. S., Massaro J. M., Hoffmann U., Pou K. M., Maurovich-Horvat P., Liu C. Y., Vasan R. S., Murabito J. M., Meigs J. B., Cupples L. A., et al. . 2007. Abdominal visceral and subcutaneous adipose tissue compartments: association with metabolic risk factors in the Framingham Heart Study. Circulation. 116: 39–48. - PubMed
    1. Karpe F., and Pinnick K. E.. 2015. Biology of upper-body and lower-body adipose tissue–link to whole-body phenotypes. Nat. Rev. Endocrinol. 11: 90–100. - PubMed
    1. McLaughlin T., Lamendola C., Liu A., and Abbasi F.. 2011. Preferential fat deposition in subcutaneous versus visceral depots is associated with insulin sensitivity. J. Clin. Endocrinol. Metab. 96: E1756–E1760. - PMC - PubMed
    1. Flynn E. J. 3rd, Trent C. M., and Rawls J. F.. 2009. Ontogeny and nutritional control of adipogenesis in zebrafish (Danio rerio). J. Lipid Res. 50: 1641–1652. - PMC - PubMed

Publication types