. 2018 Jul;59(7):1148-1163.
doi: 10.1194/jlr.M080788. Epub 2018 May 23.

Sphingolipid changes do not underlie fatty acid-evoked GLUT4 insulin resistance nor inflammation signals in muscle cells

Affiliations

Sphingolipid changes do not underlie fatty acid-evoked GLUT4 insulin resistance nor inflammation signals in muscle cells

Nicolas J Pillon et al. J Lipid Res. 2018 Jul.

Abstract

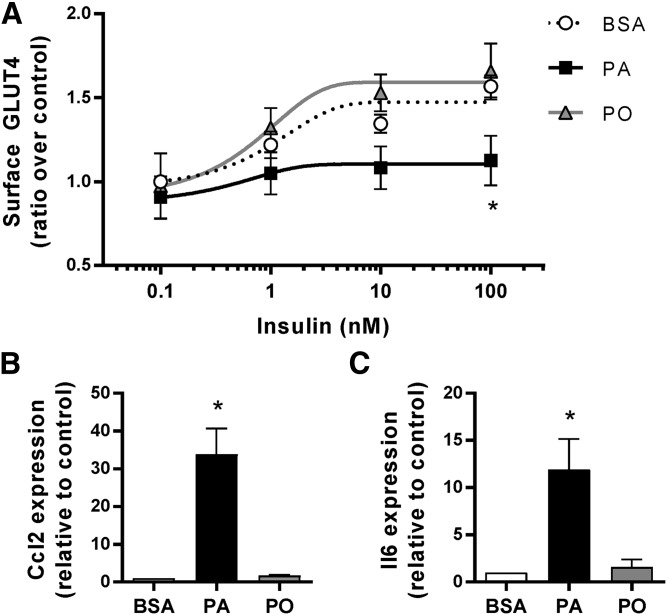
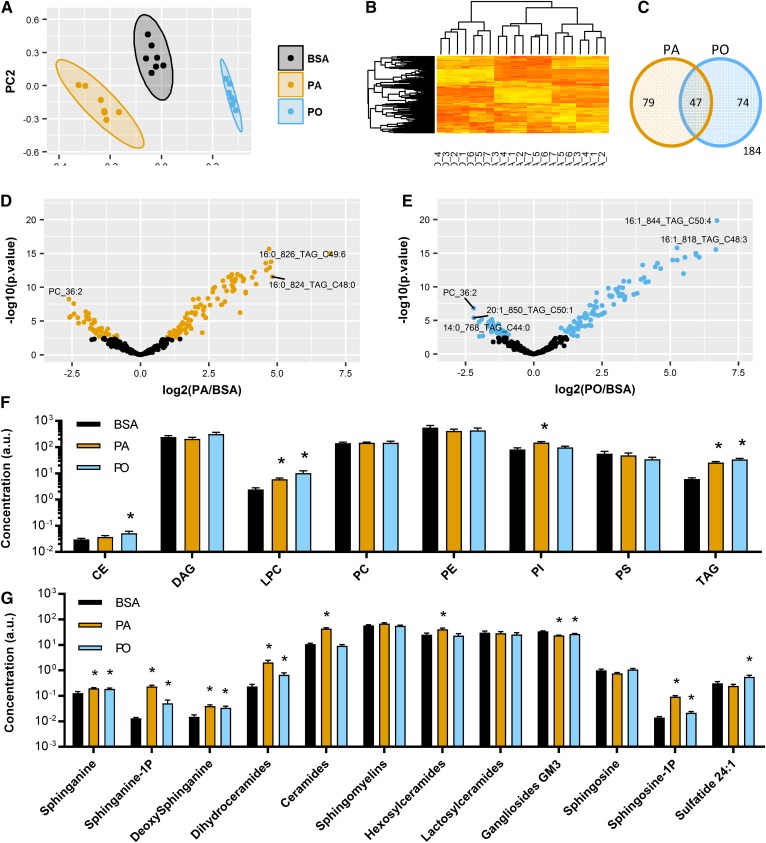
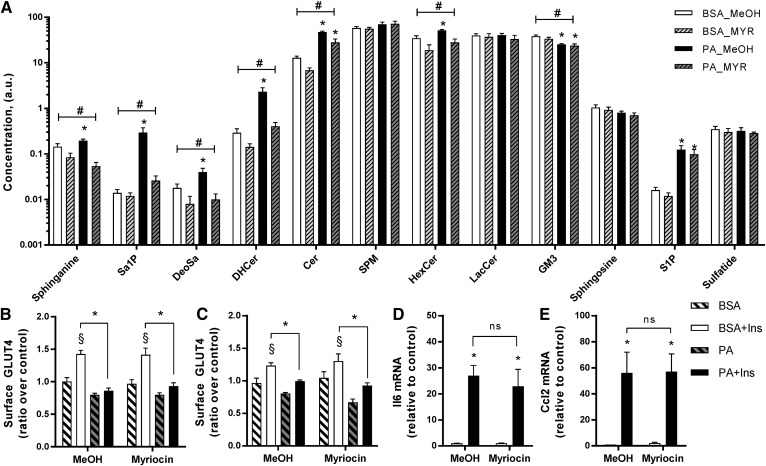
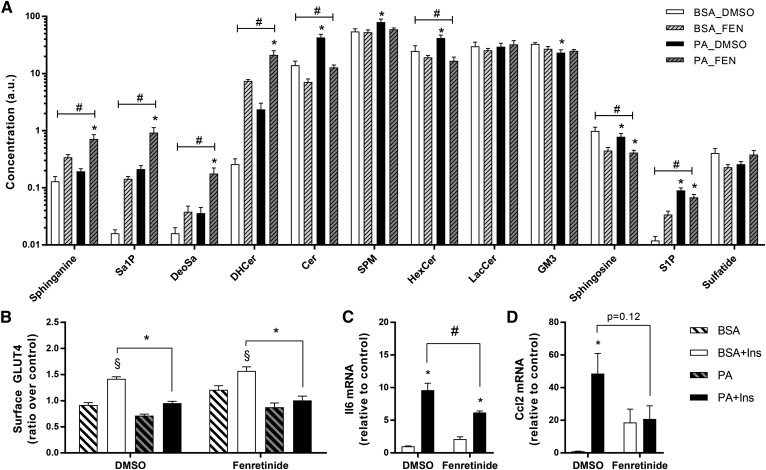
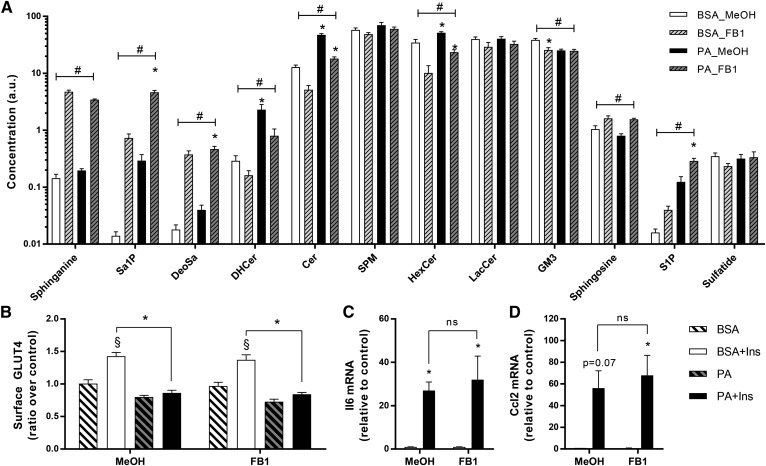
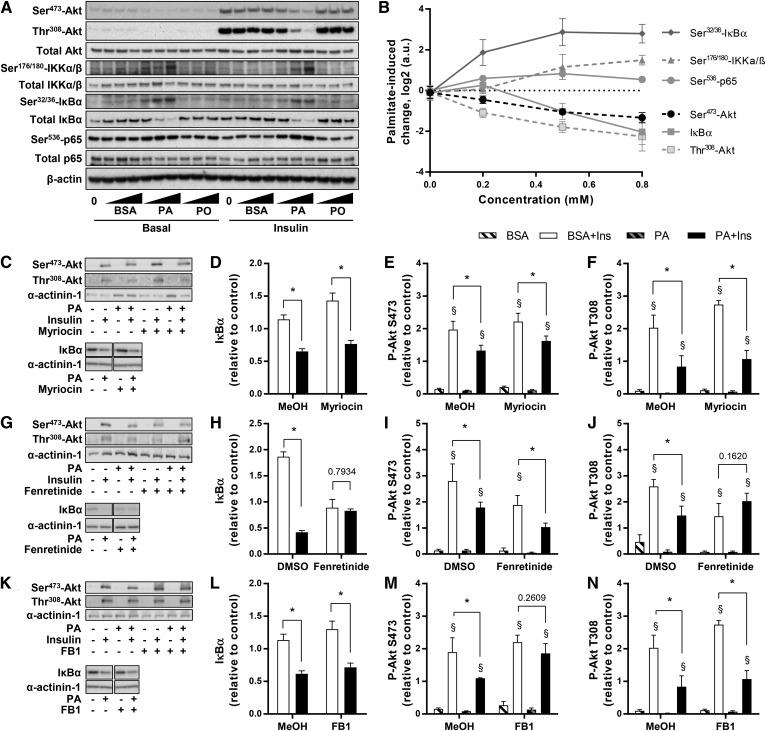
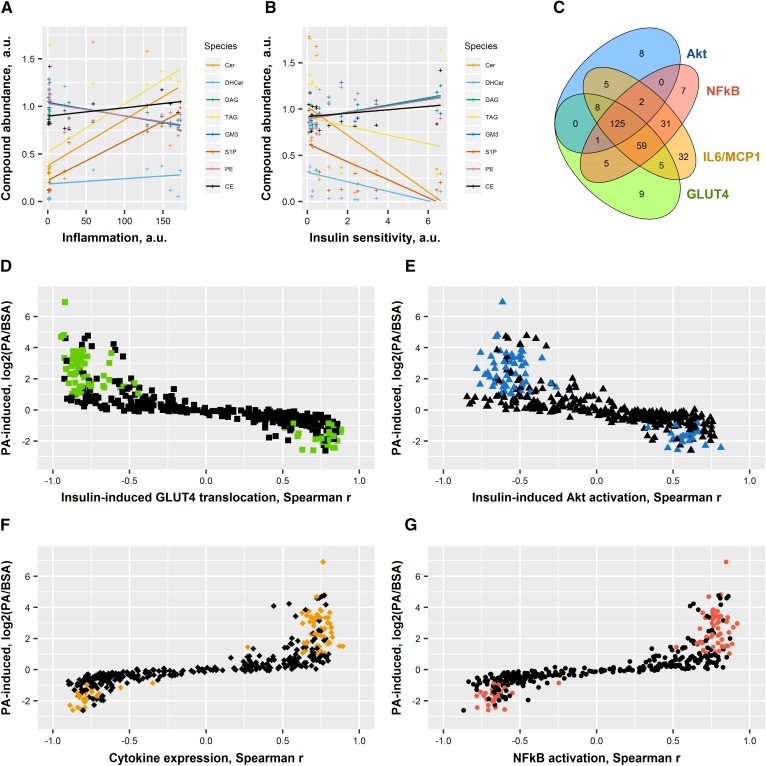
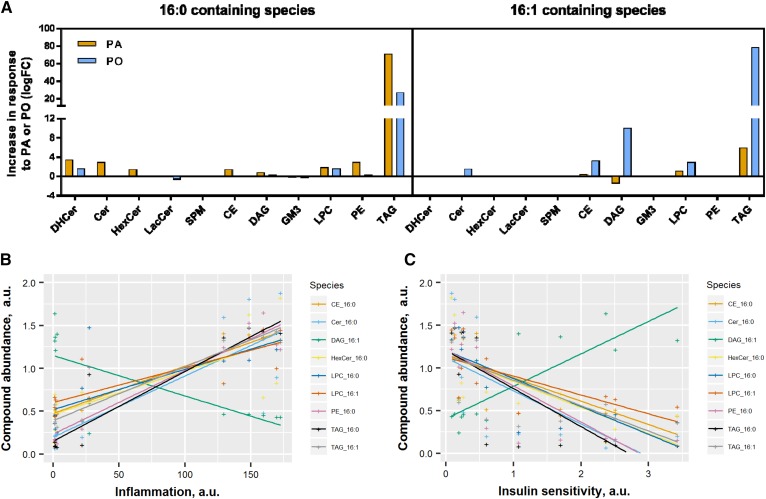
Ceramides contribute to obesity-linked insulin resistance and inflammation in vivo, but whether this is a cell-autonomous phenomenon is debated, particularly in muscle, which dictates whole-body glucose uptake. We comprehensively analyzed lipid species produced in response to fatty acids and examined the consequence to insulin resistance and pro-inflammatory pathways. L6 myotubes were incubated with BSA-adsorbed palmitate or palmitoleate in the presence of myriocin, fenretinide, or fumonisin B1. Lipid species were determined by lipidomic analysis. Insulin sensitivity was scored by Akt phosphorylation and glucose transporter 4 (GLUT4) translocation, while pro-inflammatory indices were estimated by IκBα degradation and cytokine expression. Palmitate, but not palmitoleate, had mild effects on Akt phosphorylation but significantly inhibited insulin-stimulated GLUT4 translocation and increased expression of pro-inflammatory cytokines Il6 and Ccl2 Ceramides, hexosylceramides, and sphingosine-1-phosphate significantly heightened by palmitate correlated negatively with insulin sensitivity and positively with pro-inflammatory indices. Inhibition of sphingolipid pathways led to marked changes in cellular lipids, but did not prevent palmitate-induced impairment of insulin-stimulated GLUT4 translocation, suggesting that palmitate-induced accumulation of deleterious lipids and insulin resistance are correlated but independent events in myotubes. We propose that muscle cell-endogenous ceramide production does not evoke insulin resistance and that deleterious effects of ceramides in vivo may arise through ancillary cell communication.

Keywords: ceramides; glucose transporter 4; inflammation; lipidomics.


Conflict of interest statement

The authors declare no financial conflicts of interest.

Figures

Fig. 1.
Fig. 1.
Palmitate, but not palmitoleate, impairs insulin action and activates inflammatory signals. L6 myotubes were exposed to 0.5 mM PA, PO, or the BSA vehicle for 18 h and then stimulated with 100 nM insulin for 20 min. A: Surface GLUT4 was measured as described in the Methods (n = 4; *P < 0.05 vs. BSA control). B, C: Ccl2 and Il6 expression was measured by qPCR (n = 3; *P < 0.05 vs. BSA control).
Fig. 2.
Fig. 2.
Lipidomic analysis reveals selective increases in lipid species by palmitate and palmitoleate. L6 myotubes were exposed to 0.5 mM PA, PO, or the BSA vehicle for 18 h. Cells were extracted and lipidomic analysis performed as described in the Methods (n = 7). A: Primary component analysis comparing PA, PO, and BSA groups. B: Heat map showing clustering of all lipid species and treatment groups. C: Venn diagram showing overlap of significantly changed lipid species (t-test, FDR <0.01) after treatment with PA or PO compared with the BSA control. Individual species are available in Tables 1 and 2. D, E: Volcano plots of lipid species induced by the treatment with PA or PO. The colored dots pass the threshold for statistical significance (FDR <0.01, t-test). F, G: Sum of lipid species by families (t-test vs. BSA control, *P < 0.05).
Fig. 3.
Fig. 3.
Inhibition of the de novo pathway with myriocin does not reverse palmitate-induced insulin resistance and inflammation. Myotubes were pretreated with myriocin (25 μM) or the methanol (MeOH) vehicle for 30 min and then incubated with 0.5 mM PA in the presence of myriocin for 18 h. A: Lipid species were measured in L6 myotubes using lipidomic analysis as described in the Methods (n = 7). B: Surface GLUT4 was measured in L6-GLUT4myc myotubes as described in the Methods [n = 7; three-way ANOVA (insulin, PA, myriocin)]. C: Surface GLUT4 was measured in C2C12-GLUTmyc myotubes as described in the Methods [n = 3; three-way ANOVA (insulin, PA, myriocin)]. D, E: Expression of Ccl2 and Il6 in L6 myotubes after PA and myriocin exposure was measured by qPCR [n = 4; two-way ANOVA (PA, myriocin)]. #Overall significant effect of inhibitor (two-way ANOVA; P < 0.05; n ≥ 5). *Significant effect of PA over BSA control (two-way ANOVA; P < 0.05). §Significant effect of insulin over unstimulated control (P < 0.05). DHCer, dihydroceramide; HexCer, hexosylceramide; SPM, sphingomyelin; LacCer, lactosylceramide; MYR, myriocin.
Fig. 4.
Fig. 4.
Inhibition of the de novo pathway with fenretinide does not reverse palmitate-induced insulin resistance, but reduces palmitate-induced inflammation. L6 myotubes were pretreated with fenretinide (10 μM) for 30 min and then incubated with 0.5 mM PA in the presence of fenretinide for 18 h. A: Lipid species were measured using lipidomics as described in the Methods. B: Surface GLUT4 was measured as described in the Methods [n = 9; three-way ANOVA (insulin, PA, fenretinide)]. C, D. Expression of Ccl2 and Il6 after PA and fenretinide exposure was measured by qPCR [n = 7; two-way ANOVA (PA, fenretinide)]. #Overall significant effect of inhibitor (two-way ANOVA; P < 0.05). *Significant effect of PA over BSA control (two-way ANOVA; P < 0.05). §Significant effect of insulin over unstimulated control (P < 0.05). DHCer, dihydroceramide; HexCer, hexosylceramide; SPM, sphingomyelin; LacCer, lactosylceramide; FEN, fenretinide.
Fig. 5.
Fig. 5.
FB1 does not reverse palmitate-induced insulin resistance and inflammation. L6 myotubes were pretreated with FB1 (50 μM) for 30 min and then incubated with 0.5 mM PA in the presence of FB1 for 18 h. A: Lipid species were identified by lipidomics as described in the Methods. B: Surface GLUT4 was measured as described in the Methods [n = 7; three-way ANOVA (insulin, PA, FB1)]. C, D: Expression of Ccl2 and Il6 after PA and FB1 exposure was measured by qPCR [n = 4; two-way ANOVA (PA, FB1)]. #Overall significant effect of inhibitor (two-way ANOVA; P < 0.05). *Significant effect of PA over BSA control (two-way ANOVA; P < 0.05). §Significant effect of insulin over unstimulated control (P < 0.05). DHCer, dihydroceramide; HexCer, hexosylceramide; SPM, sphingomyelin; LacCer, lactosylceramide; MeOH, methanol.
Fig. 6.
Fig. 6.
Insulin and inflammatory signaling pathways. A, B: L6 myotubes were exposed to 0, 0.2, 0.5, or 0.8 mM PA or PO for 18 h, serum starved for 2 h, and stimulated with 2 nM insulin for 10 min. Akt, IKK, IκBα, and p65 were measured using specific antibodies. C–F: Effect of PA and myriocin was measured by Western blot for insulin-stimulated phosphorylation of Akt [n ≥ 3; three-way ANOVA (insulin, PA, myriocin)] and degradation of IκBα [n = 6; two-way ANOVA (PA, myriocin)]. G–J: Effect of PA and fenretinide was measured by Western blot for insulin-stimulated phosphorylation of Akt [n ≥ 3; three-way ANOVA (insulin, PA, fenretinide)] and degradation of IκBα [n = 6; two-way ANOVA (PA, fenretinide)]. K–N: Effect of PA and FB1 was measured by Western blot for insulin-stimulated phosphorylation of Akt [n ≥ 3; three-way ANOVA (insulin, PA, FB1)] and degradation of IκBα [n = 6; two-way ANOVA (PA, FB1)]. *Significant effect of PA over BSA control (two-way ANOVA; P < 0.05). §Significant effect of insulin over unstimulated control (P < 0.05). MeOH, methanol.
Fig. 7.
Fig. 7.
Correlations between lipid species, insulin sensitivity, and inflammation. Spearman correlations were drawn between each individual compound and the measurements of insulin sensitivity (surface GLUT4 and Akt activation) and inflammation (Il6, Ccl2 expression, and IκBα). Colored dots are the 79 species significantly increased specifically by PA. A: Species changed by PA and correlated with inflammation [(Il6 + Ccl2)/IκBα]. B: Species changed by PA and correlated with insulin sensitivity (GLUT4 × Ser473 × Thr308). C: Venn diagram showing overlap between the different parameters for every individual species. D: Species changed by PA and correlated with GLUT4 translocation. E: Species changed by PA and correlated with Akt activation (average Ser473 and Thr308). F: Species changed by PA and correlated with cytokine expression (average Ccl2 and Il6). G: Species changed by PA and correlated with NFκB activation (1/IκBα). Individual values are presented in Tables 1 and 2. Cer, ceramide; DHCer, dihydroceramide.
Fig. 8.
Fig. 8.
DAGs containing 16:1 are positively associated with insulin sensitivity. All the 16:0- and 16:1-containing species were analyzed for their response to PA and PO and their correlation with the measurements of insulin sensitivity (surface GLUT4 and Akt activation) and inflammation (Il6, Ccl2 expression, and IκBα). A: Fold-change induced by PA and PO. B: Correlation with inflammation [(Il6 + Ccl2 expression)/IκBα levels]. C: Correlation with insulin sensitivity (GLUT4 × Ser473 × Thr308). DHCer, dihydroceramide; HexCer, hexosylceramide; SPM, sphingomyelin; LacCer, lactosylceramide.

Similar articles

Cited by

References

    1. Coen P. M., and Goodpaster B. H.. 2012. Role of intramyocelluar lipids in human health. Trends Endocrinol. Metab. 23: 391–398. - PMC - PubMed
    1. Iqbal J., Walsh M. T., Hammad S. M., and Hussain M. M.. 2017. Sphingolipids and lipoproteins in health and metabolic disorders. Trends Endocrinol. Metab. 28: 506–518. - PMC - PubMed
    1. Summers S. A. 2018. Could ceramides become the new cholesterol? Cell Metab. 27: 276–280. - PubMed
    1. Boon J., Hoy A. J., Stark R., Brown R. D., Meex R. C., Henstridge D. C., Schenk S., Meikle P. J., Horowitz J. F., Kingwell B. A., et al. . 2013. Ceramides contained in LDL are elevated in type 2 diabetes and promote inflammation and skeletal muscle insulin resistance. Diabetes. 62: 401–410. - PMC - PubMed
    1. Petersen M. C., and Jurczak M. J.. 2016. CrossTalk opposing view: intramyocellular ceramide accumulation does not modulate insulin resistance. J. Physiol. 594: 3171–3174. - PMC - PubMed

Publication types

LinkOut - more resources