Observational Study
. 2018 Jun 4;215(6):1589-1608.
doi: 10.1084/jem.20180246. Epub 2018 May 24.

Distinct, IgG1-driven antibody response landscapes demarcate individuals with broadly HIV-1 neutralizing activity

Affiliations
Observational Study

Distinct, IgG1-driven antibody response landscapes demarcate individuals with broadly HIV-1 neutralizing activity

Claus Kadelka et al. J Exp Med. .

Abstract

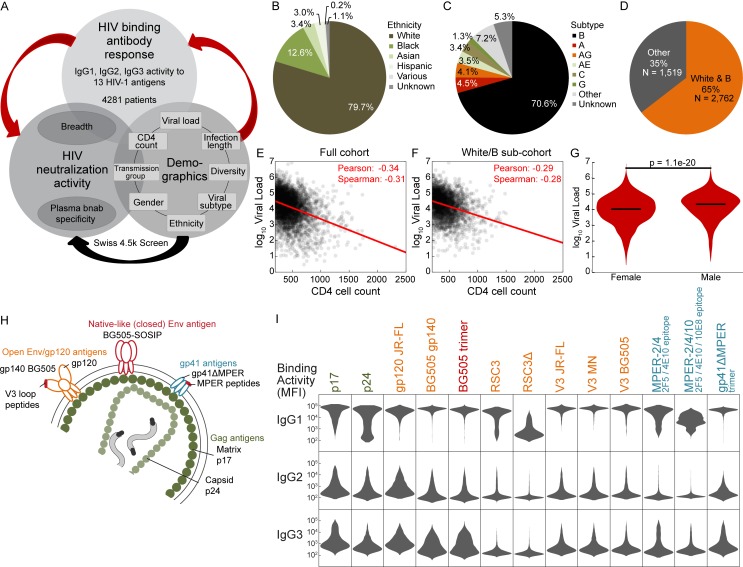
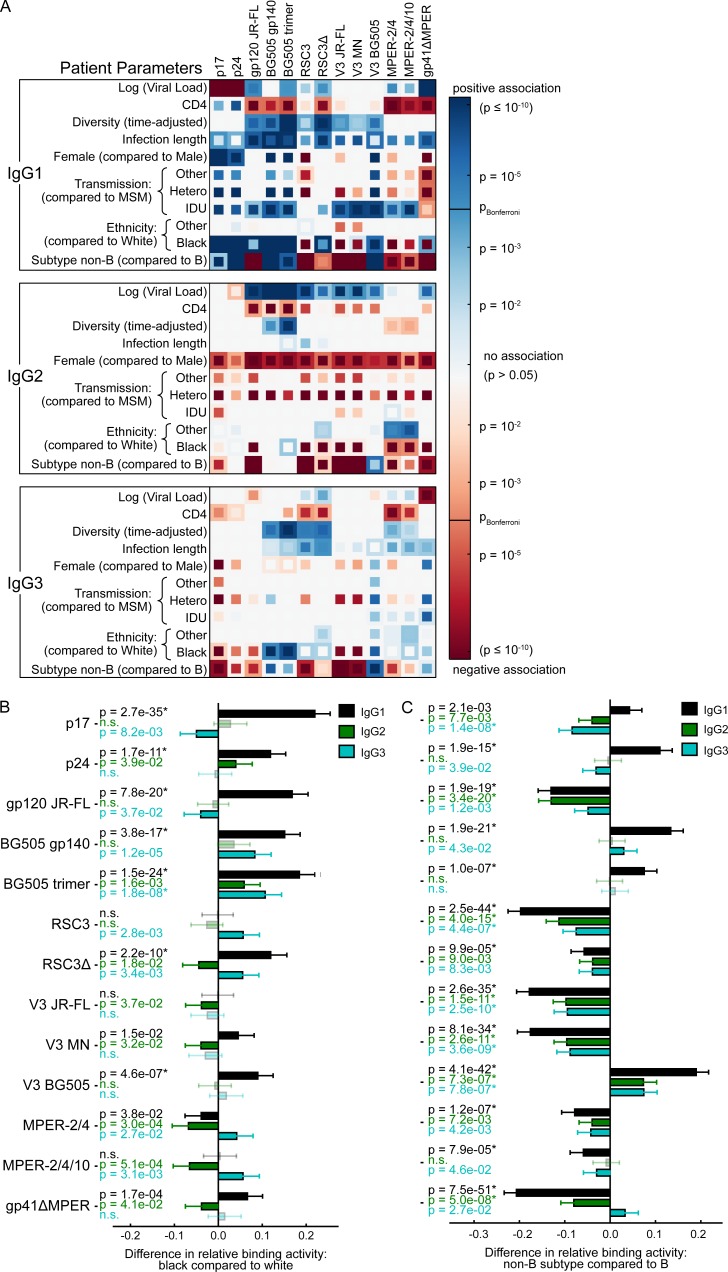
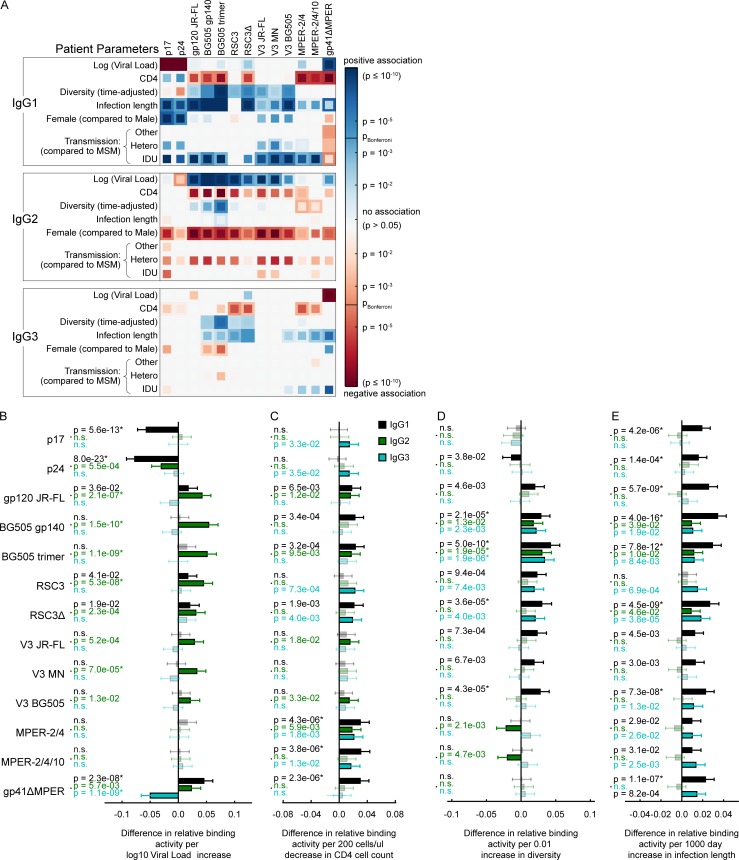
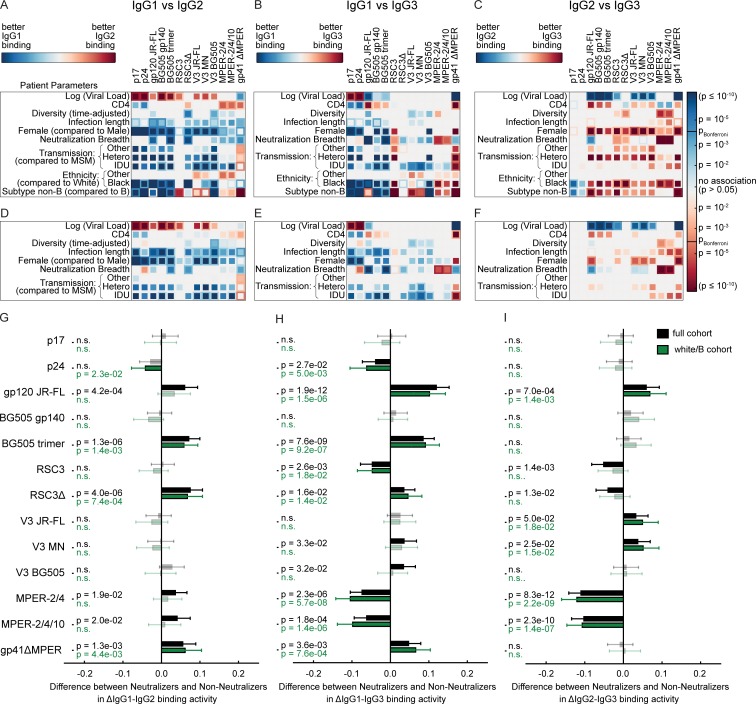
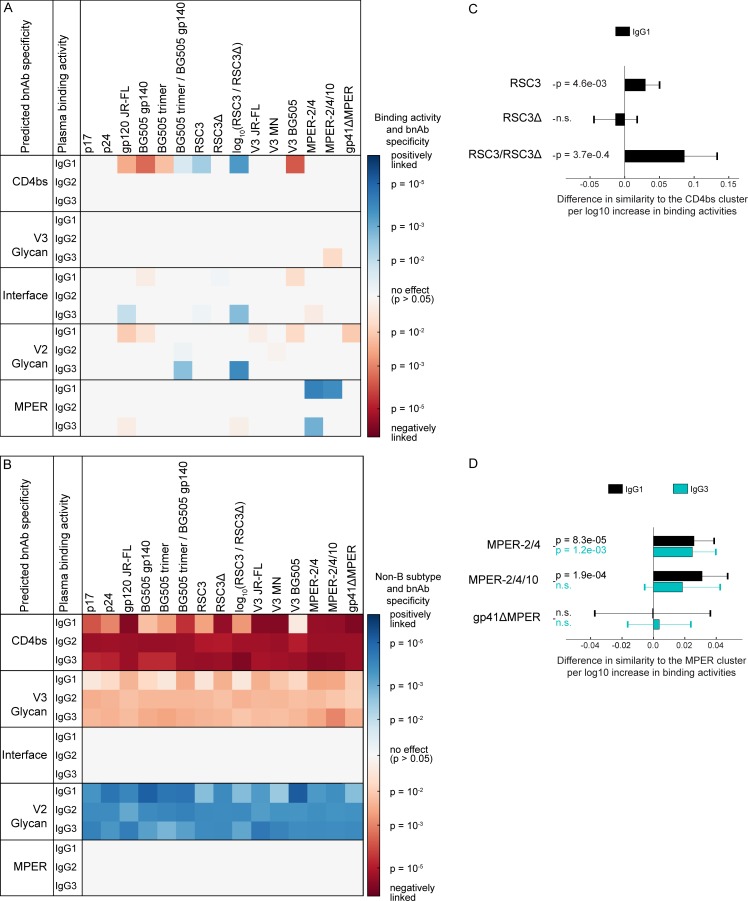
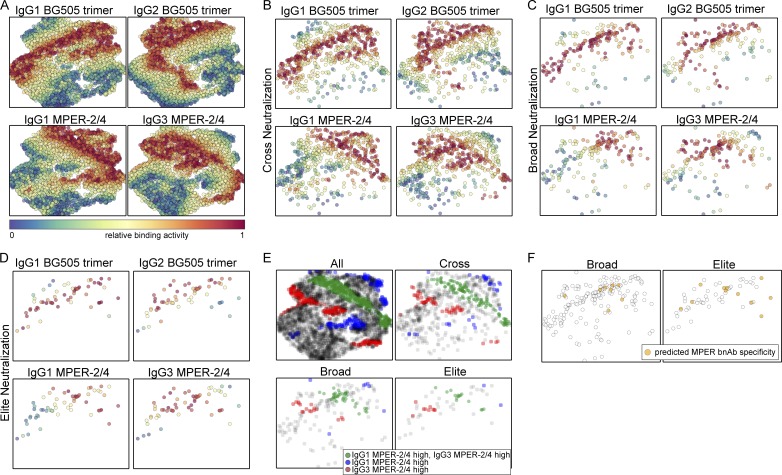
Understanding pathways that promote HIV-1 broadly neutralizing antibody (bnAb) induction is crucial to advance bnAb-based vaccines. We recently demarcated host, viral, and disease parameters associated with bnAb development in a large HIV-1 cohort screen. By establishing comprehensive antibody signatures based on IgG1, IgG2, and IgG3 activity to 13 HIV-1 antigens in 4,281 individuals in the same cohort, we now show that the same four parameters that are significantly linked with neutralization breadth, namely viral load, infection length, viral diversity, and ethnicity, also strongly influence HIV-1-binding antibody responses. However, the effects proved selective, shaping binding antibody responses in an antigen and IgG subclass-dependent manner. IgG response landscapes in bnAb inducers indicated a differentially regulated, IgG1-driven HIV-1 antigen response, and IgG1 binding of the BG505 SOSIP trimer proved the best predictor of HIV-1 neutralization breadth in plasma. Our findings emphasize the need to unravel immune modulators that underlie the differentially regulated IgG response in bnAb inducers to guide vaccine development.


Figures

Figure 1.
Figure 1.
Systematic survey of IgG subclass responses to HIV-1 Env and Gag antigens. (A) Experimental study design. Red arrows indicate aspects examined in the current study. (B and C) Distribution of ethnicities (B) and HIV-1 subtypes (C) in the cohort. (D) Relative size of the white/B subcohort. (E and F) Scatterplot of log10 viral load and CD4 cell count for the full cohort (E) and the white/B subcohort (F). A red linear regression line and the Spearman and Pearson correlation coefficients are shown. (G) Distribution of log10 viral load in females and males in the full cohort (pMann-Whitney = 1.1e-20). (H) Overview of 13 HIV-1 antigens selected for IgG response monitoring. (I) Summary of measured IgG-binding antibody response (MFI raw data; Luminex binding assay; single measurements) in 4,281 chronic HIV-1–infected individuals. Relative binding activities (Table S1) derived from these MFI raw data were used for further analysis.
Figure 2.
Figure 2.
Influence of host, viral and disease parameters on binding antibody responses across all ethnicities. (A) The influence of the virus load, CD4 count, viral diversity, length of untreated HIV-1 infection, transmission route, gender, ethnicity, and HIV-1 subtype on binding antibody responses to each tested HIV-1 antigen was determined by univariable (inner squares) and multivariable (outer squares) linear regression for all three IgG subclasses (n = 3,159). Only significant associations (P < 0.05) are colored, and the Bonferroni-corrected significance threshold (P = 0.00012) is shown in the color map. Color intensity represents the significance level of positive (blue) and negative (red) associations. See Table S3 for detailed regression results. (B and C) Impact of the indicated parameter on the relative IgG1 (black), IgG2 (green), and IgG3 (blue) binding activity, based on the same multivariable linear regression analysis as in A. Error bars depict the 95% confidence intervals. Nonsignificant associations are marked by n.s. and are shown in lighter color shades. * highlights significant associations when using a Bonferroni correction for multiple testing. (B) Influence of black compared with white individuals. (C) Non–B-infected compared with B-infected individuals.
Figure 3.
Figure 3.
Influence of host, viral and disease parameters on binding antibody responses in the white/B subcohort. (A) The influence of the virus load, CD4 count, viral diversity, length of untreated HIV-1 infection, gender, and transmission route on binding antibody responses was determined by univariable (inner squares) and multivariable (outer squares) linear regression for each IgG subclass and each HIV-1 antigen (n = 2,122). Only significant associations (P < 0.05) are colored, and the Bonferroni-corrected significance threshold (P = 0.00016) is shown in the color map. Color intensity represents the significance level of positive (blue) and negative (red) associations. See Table S3 for detailed regression results. (B–E) Impact of the indicated parameter on the relative IgG1 (black), IgG2 (green), and IgG3 (blue) binding activity, based on the same multivariable linear regression analysis as in A. Error bars depict the 95% confidence intervals. Nonsignificant associations are marked by n.s. and are shown in lighter color shades. * highlights significant associations when using a Bonferroni correction for multiple testing. (B) Impact of viral load per unit increase in log10 viral copy numbers per milliliter of blood. (C) Impact of CD4 cell count per 200 cells/µl decrease in CD4 cell count. (D) Impact of viral diversity per 0.01 increase in pol diversity. (E) Impact of infection length per 1,000 d increase in length of untreated HIV-1 infection.
Figure 4.
Figure 4.
Comparison of relative binding activities between IgG subclasses. (A–I) Analysis of the full cohort (n = 3,159; A–C and G–I) and the white/B subcohort (n = 2,122; D–I) with complete data on the included host, viral, and disease parameters. The influence of the virus load, CD4 count, viral diversity, length of untreated HIV-1 infection, transmission route, gender, neutralization breadth (at least cross neutralization), ethnicity, and HIV-1 subtype on the differences in binding antibody responses to each tested HIV-1 antigen was determined by univariable (inner squares) and multivariable (outer squares) linear regression for all three pairs of IgG subclasses. Only significant associations (P < 0.05) are colored, and the Bonferroni-corrected significance threshold (P = 0.00012) is shown in the color map. The color intensity represents the significance level. (G–I) Difference in neutralizers and nonneutralizers in differential IgG subclass (ΔIgG) binding activity, based on the same multivariable linear regression analysis as in A–F. Error bars depict the 95% confidence intervals. Nonsignificant associations are marked by n.s. and are shown in lighter color shades.
Figure 5.
Figure 5.
Distribution of untreated infection length and set-up of correlation network analyses. (A) Patient selection for the antibody response landscape analyses in Figs. 6 and 7. (B) Distribution of untreated infection length in the white/B subcohort. Colors distinguish early (n = 519) and late (n = 2,243) chronic infection and indicate subcohorts of early and late infection analyzed in Fig. 7. All samples with an untreated infection of >15 yr are grouped together (n = 96). (C) Distribution of untreated infection length in the white/B subcohort in individuals with 3- to 10-yr untreated infection and with no or weak neutralization activity (left; n = 1,341) or potent (broad or elite) neutralization activity (right; n = 95). The two distributions do not differ significantly (pMann-Whitney = 0.70). (D) Example of the correlation network analyses shown in Figs. 6 (A–C) and 7 (A–C). The relative binding activities to each antigen and each IgG subclass were compared with all other relative binding activities, as exemplified for IgG1 BG505 trimer binding. (E) Example of the correlation network analysis as conducted in Figs. 6 D and 7 D. Only the correlations between the IgG1 and IgG2 responses of the same antigen were investigated. Correlations for IgG1/IgG3 and IgG2/IgG3 responses were conducted the same way.
Figure 6.
Figure 6.
Differential landscape of HIV-1 IgG responses in broad neutralizers. (A and B) Pairwise Spearman correlation analysis of the relative binding activities to the 13 HIV-1 antigens within and between subclass IgG1 (dark green), IgG2 (light green), and IgG3 (gray) in white subtype B–infected patients with late chronic (3- to 10-yr untreated) infection. Correlations with a magnitude >0.15 are depicted in blue (positive associations) and red (negative associations). The strength of Spearman correlation is signified by color intensity for correlations with magnitudes from 0.15 to 0.5 and additionally by line width for magnitudes >0.5. (A) Patients with no or low neutralizing activity (n = 1,673). (B) Patients with broad or elite neutralizing activity (n = 143). (C) Significant differences (pshuffle < 0.05; 10,000 random reshuffles) in pairwise Spearman correlations between broad neutralizers (as in B) and nonneutralizers (as in A) are shown. Green and orange shaded lines denote correlations that increase or decrease among broad neutralizers, respectively. The significance level of differences is depicted by color intensity and additionally by line width for differences that remain significant after correction for multiple testing (Benjamini-Hochberg correction with a false discovery rate of 10%; pshuffle ≤ 0.0016). (D) The distribution of all pairwise between IgG subclass correlations of individual antigens (Fig. 5 E) is shown for the nonneutralizers (light violet) and potent (broad or elite) neutralizers (dark violet). Significant p-values from a paired Wilcoxon test are shown.
Figure 7.
Figure 7.
Correlations of antibody binding responses in early and late chronic infection. (A and B) Pairwise Spearman correlation analysis of the relative binding activities to the 13 HIV-1 antigens within and between subclass IgG1 (dark green), IgG2 (light green), and IgG3 (gray) in white subtype B infected patients with early chronic (1–3 yr untreated infection; n = 519; A) and late chronic (>3 yr untreated infection; n = 2,243; B) infection. Correlations with a magnitude >0.15 are depicted in blue (positive associations) and red (negative associations). The strength of Spearman correlation is signified by color intensity for correlations with magnitudes from 0.15 to 0.5 and by the strongest color intensity and line width for magnitudes >0.5. (C) Significant differences (pshuffle < 0.05; 10,000 random reshuffles) in pairwise Spearman correlations between early chronic (as in A) and late chronic (as in B) patients are shown. Green and orange shaded lines denote correlations that increase or decrease among late chronic patients, respectively. The significance level of differences is depicted by color intensity and by line width for differences that remain significant after correction for multiple testing (Benjamini-Hochberg correction with a false discovery rate of 10%; pshuffle ≤ 0.0148). (D) The distribution of all pairwise “between IgG subclass” correlations of individual antigens (Fig. 5 E) is shown for the early chronic (green) and the late chronic (violet) patients. Significant p-values from a paired Wilcoxon test are shown.
Figure 8.
Figure 8.
HIV-1–binding antibody responses predict bnAb activity. Analysis of white/B subcohort (n = 2,762). (A) Frequency comparison of antigen reactivity in patient groups with no or weak- (n = 2,155; light gray), cross- (n = 453; dark gray), broad- (n = 123; black), and elite- (n = 31; red) neutralizing activity (Table S2). For each antigen and each IgG subclass, plasma samples were distributed into ten groups based on their relative binding activity, and the distribution of neutralizers and nonneutralizers across these groups is depicted. (B and C) Relative binding activities were used in logistic regression models to predict whether a plasma with known elite- (red), at least broad- (broad and elite activity: black) or at least cross- (cross, broad, and elite activity: dark gray) neutralizing activity was part of the respective group. The AUC of the ROC using fivefold cross validation and 100 repetitions was used to measure predictive strength. (B) Comparison of the predictive strength (shades of blue based on AUC values) of all single binding antibody responses. (C) ROC curve using IgG1 BG505 trimer binding as predictor. Dashed lines indicate the respective true positive rates of cross, broad, and elite neutralization at fixed false positive rates of 0.1 and 0.3. The black dotted line y = x indicates the expected performance of a random prediction. (D) Best multivariable prediction model for cross, broad, and elite neutralization. The best model with a certain number of variables (up to three) is learned in a greedy fashion and depicted. (+) indicates antibody-binding responses with a positive parameter in the model (high binding responses are predictive of neutralization breadth). (−) indicates negative parameters (low-binding responses are predictive of neutralization breadth). (E–G) At each step, the four best choices are shown from top (best) to bottom (fourth best). The respective AUC values and a representation of the impact of each binding activity on the respective model are also depicted. Antibody binding responses indicated in blue have a positive parameter in the model; red denotes a negative parameter. (E) Best prediction for cross neutralization. (F) Best prediction for broad neutralization. (G) Best prediction for elite neutralization. See Table S4 for AUC values and comparable findings for the full cohort.
Figure 9.
Figure 9.
HIV-1–binding antibody responses associated with specific bnAb types. (A and B) Definition of binding patterns that predict bnAb types. The association of two variables, the log10 IgG binding activities (single measurements; A), and the infecting subtype (B vs. non-B) on various bnAb specificities (B) was determined by multivariable linear regression, using the Spearman neutralization fingerprint similarity with bnAb clusters of the top neutralizing plasma samples (n = 105) as defined in Rusert et al. (2016) as a marker of bnAb specificity. Significant associations (P < 0.05) are colored, with positive and negative associations indicated in blue and red, respectively. The color intensity represents the significance level. (C and D) Magnitude and significance of associations between the IgG response to CD4bs antigens and CD4bs bnAb activity (C) and MPER antigens and MPER bnAb specificity (D), based on the same multivariable linear regression analysis as in A and B. Error bars depict the 95% confidence intervals. Nonsignificant associations (P > 0.05) are marked by n.s.
Figure 10.
Figure 10.
Two-dimensional representation of all plasma samples based on binding antibody responses. Two-dimensional t-SNE map (Barnes-Hut-SNE approximation with 1,000 iterations) of all plasma samples (n = 4,281) based on the relative binding activities to BG505 trimer (IgG1 and IgG2) and MPER-2/4 (IgG1 and IgG3). (A) Points in each subplot are colored by the strength of response to one of the four relative binding activities (red color denotes high binding activity, and blue denotes low binding activity). (B–D) The t-SNE map from A is stratified by neutralization capacity, cross (n = 684; C), broad (n = 178; D), and elite (n = 58; E) neutralization. (E) The t-SNE map from A is stratified by neutralization capacity of plasma (all, cross, broad, or elite neutralization). Plasma with high relative binding (>0.667) for either IgG1 (blue) or IgG3 (red) MPER-2/4 or both (green) is colored. (F) The t-SNE map from A is stratified by neutralization capacity of plasma (broad or elite neutralization). Plasma with predicted MPER specificity (n = 19) is colored.

References

    1. Ackerman M.E., Mikhailova A., Brown E.P., Dowell K.G., Walker B.D., Bailey-Kellogg C., Suscovich T.J., and Alter G.. 2016. Polyfunctional HIV-Specific Antibody Responses Are Associated with Spontaneous HIV Control. PLoS Pathog. 12:e1005315 10.1371/journal.ppat.1005315 - DOI - PMC - PubMed
    1. Ackerman M.E., Barouch D.H., and Alter G.. 2017. Systems serology for evaluation of HIV vaccine trials. Immunol. Rev. 275:262–270. 10.1111/imr.12503 - DOI - PMC - PubMed
    1. Banerjee K., Klasse P.J., Sanders R.W., Pereyra F., Michael E., Lu M., Walker B.D., and Moore J.P.. 2010. IgG subclass profiles in infected HIV type 1 controllers and chronic progressors and in uninfected recipients of Env vaccines. AIDS Res. Hum. Retroviruses. 26:445–458. 10.1089/aid.2009.0223 - DOI - PMC - PubMed
    1. Bhiman J.N., Anthony C., Doria-Rose N.A., Karimanzira O., Schramm C.A., Khoza T., Kitchin D., Botha G., Gorman J., Garrett N.J., et al. . 2015. Viral variants that initiate and drive maturation of V1V2-directed HIV-1 broadly neutralizing antibodies. Nat. Med. 21:1332–1336. 10.1038/nm.3963 - DOI - PMC - PubMed
    1. Binley J.M., Klasse P.J., Cao Y., Jones I., Markowitz M., Ho D.D., and Moore J.P.. 1997. Differential regulation of the antibody responses to Gag and Env proteins of human immunodeficiency virus type 1. J. Virol. 71:2799–2809. - PMC - PubMed

Publication types

MeSH terms

Substances