. 2018 Aug;29(8):2060-2068.
doi: 10.1681/ASN.2018030238. Epub 2018 May 24.

A Single-Cell Transcriptome Atlas of the Mouse Glomerulus

Affiliations

A Single-Cell Transcriptome Atlas of the Mouse Glomerulus

Nikos Karaiskos et al. J Am Soc Nephrol. 2018 Aug.

Abstract

Background Three different cell types constitute the glomerular filter: mesangial cells, endothelial cells, and podocytes. However, to what extent cellular heterogeneity exists within healthy glomerular cell populations remains unknown.Methods We used nanodroplet-based highly parallel transcriptional profiling to characterize the cellular content of purified wild-type mouse glomeruli.Results Unsupervised clustering of nearly 13,000 single-cell transcriptomes identified the three known glomerular cell types. We provide a comprehensive online atlas of gene expression in glomerular cells that can be queried and visualized using an interactive and freely available database. Novel marker genes for all glomerular cell types were identified and supported by immunohistochemistry images obtained from the Human Protein Atlas. Subclustering of endothelial cells revealed a subset of endothelium that expressed marker genes related to endothelial proliferation. By comparison, the podocyte population appeared more homogeneous but contained three smaller, previously unknown subpopulations.Conclusions Our study comprehensively characterized gene expression in individual glomerular cells and sets the stage for the dissection of glomerular function at the single-cell level in health and disease.

Keywords: glomerulus; podocyte; scRNAseq; single-cell RNA sequencing; transcriptome.


Figures

Figure 1.
Figure 1.
Single-cell RNA-sequencing identifies the relevant cell populations in purified glomeruli. (A) Study design and workflow. (B) The plot shows a two-dimensional representation (tSNE: t-Distributed Stochastic Neighbor Embedding) of global relationships among approximately 13,000 single cells expressing >350 transcripts (unique molecular identifiers). Putative cell doublets were removed by scoring cell type–exclusive markers (Supplemental Material). Five clusters became apparent that correspond to known cell types present in glomeruli (12% endothelium [n=1556], 2% mesangium [n=216], and 80% podocytes [n=10,325]) or contaminating cells from kidney tissue (6% tubules [n=828] and 0.2% immune cells [n=29]). Regarding parietal cells, none of the published marker genes were detected in any of the clusters. Cell types were identified by assessing the top most variable genes in each cluster (Supplemental Table 2). (C) Distribution and relative expression of established marker genes (violin plots) for endothelium, mesangium, podocytes, and contaminating tubular and immune cells.(D) Expression of marker genes colored on the basis of normalized expression levels (gray, low; red, high).
Figure 2.
Figure 2.
Single-cell transcriptomics reveal novel molecular markers specific to glomerular cell types. (A and B) Distribution and relative expression of individual highly variable genes (violin plots) in endothelium, mesangium, and podocytes. (A) Established markers (bold) and markers identified as relevant to the cell type in the literature (italics). (B) New marker genes identified in this study. (Left panel) Distribution and relative expression (violin plots). (Right panel) Immunohistochemistry images from the Human Protein Atlas (HPA) confirm that marker proteins are expressed in human glomeruli in a histologic pattern as predicted from single-cell transcriptional analysis in mouse glomeruli. Image areas shown (500×500 pixels =200 μm2) correspond to glomeruli taken from larger HPA images.
Figure 3.
Figure 3.
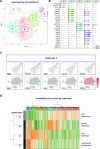
Subclustering reveals the presence of endothelial subpopulations. (A) Two-dimensional representation of a subclustering analysis of endothelial cells. Five subclusters (0–4) became apparent. (B) Distribution and relative expression of individual highly variable genes (violin plots) in the different clusters. Cluster 4 corresponds to residual cell doublets as indicated by the expression of podocyte-specific markers (Nphs2 and Cdkn1c). Doublets were excluded from further analysis. (C) Expression of markers colored on the basis of normalized expression levels. Upper panels correspond to the subcluster tSNE (t-Distributed Stochastic Neighbor Embedding) plot as shown in A, and lower panels correspond to the tSNE plot of the whole dataset as shown in Figure 1B. (D) Pathway and gene set overdispersion analysis. The heat map indicates four endothelial subclusters (0, red; 1, green; 2, blue; 3, violet) that show distinct, over-represented gene activation patterns (Supplemental Figure 3E). Corresponding gene clusters are listed in Supplemental Table 4.
Figure 4.
Figure 4.
Subclustering reveals a limited heterogeneity of podocytes. (A) Two-dimensional representation of a subclustering analysis of podocytes (tSNE: t-Distributed Stochastic Neighbor Embedding) after correction for tissue dissociation–induced stress response gene expression (Supplemental Material). Six podocyte subclusters (0–5) became apparent. (B) Distribution and relative expression of individual highly variable genes (violin plots) in subcluster 4. (C) Expression of markers in subcluster 4 (corresponding to B). Expression colored is on the basis of normalized expression levels (gray, low; red, high). (D) Laser-scanning confocal microscopy of isolated glomeruli from kidneys of transgenic Nphs2-Cre×mT/mG double-fluorescent reporter mice. Podocytes are genetically marked by Cre-dependent membrane-targeted green fluorescent protein [GFP] (green) fluorescence, whereas nonpodocyte cell types remain membrane-targeted Tomato (red) positive. (Row 1) Whole glomeruli; yellow squares in podocyte staining (green) indicate areas for magnifications as shown below. Cald1 antibody staining (upper square) and IgG control (lower square). (Rows 2 and 3) Insets from whole glomeruli as indicated. Yellow arrowheads point to GFP-positive podocytes that are Cald1 negative (row 2) or unstained by IgG control (row 3). (Rows 4 and 5) Yellow arrowheads point to a GFP-positive, Cald1-positive podocyte. Magnified areas are 22×22 μm2. Scale bars: 10 μm.

Comment in

  • 2036–2038

Similar articles

Cited by

References

    1. Brinkkoetter PT, Ising C, Benzing T: The role of the podocyte in albumin filtration. Nat Rev Nephrol 9: 328–336, 2013 - PubMed
    1. Scott RP, Quaggin SE: Review series: The cell biology of renal filtration. J Cell Biol 209: 199–210, 2015 - PMC - PubMed
    1. Neal CR, Muston PR, Njegovan D, Verrill R, Harper SJ, Deen WM, et al. .: Glomerular filtration into the subpodocyte space is highly restricted under physiological perfusion conditions. Am J Physiol Renal Physiol 293: F1787–F1798, 2007 - PubMed
    1. Macosko EZ, Basu A, Satija R, Nemesh J, Shekhar K, Goldman M, et al. .: Highly parallel genome-wide expression profiling of individual cells using nanoliter droplets. Cell 161: 1202–1214, 2015 - PMC - PubMed
    1. Satija R, Farrell JA, Gennert D, Schier AF, Regev A: Spatial reconstruction of single-cell gene expression data. Nat Biotechnol 33: 495–502, 2015 - PMC - PubMed

Publication types