Review
. 2018 Jun 4;150(6):783-807.
doi: 10.1085/jgp.201711944. Epub 2018 May 24.

The high-affinity calcium sensor synaptotagmin-7 serves multiple roles in regulated exocytosis

Affiliations
Review

The high-affinity calcium sensor synaptotagmin-7 serves multiple roles in regulated exocytosis

Daniel D MacDougall et al. J Gen Physiol. .

Abstract

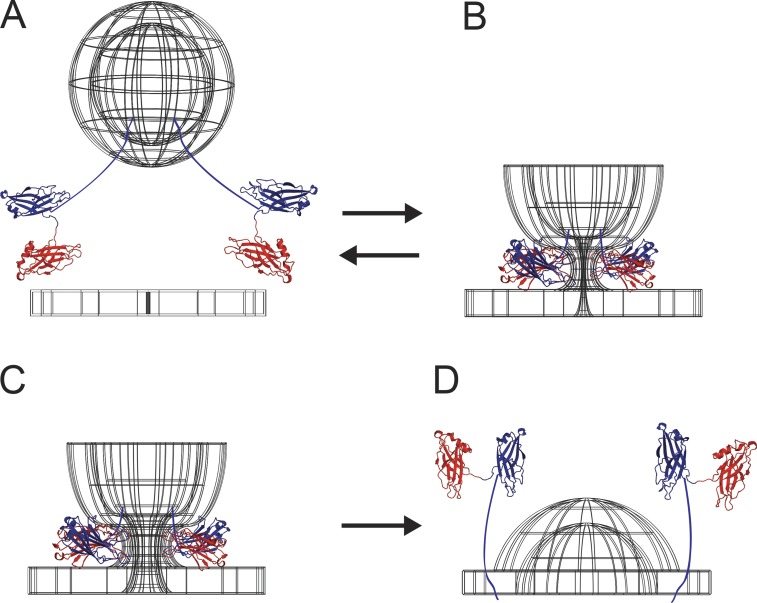
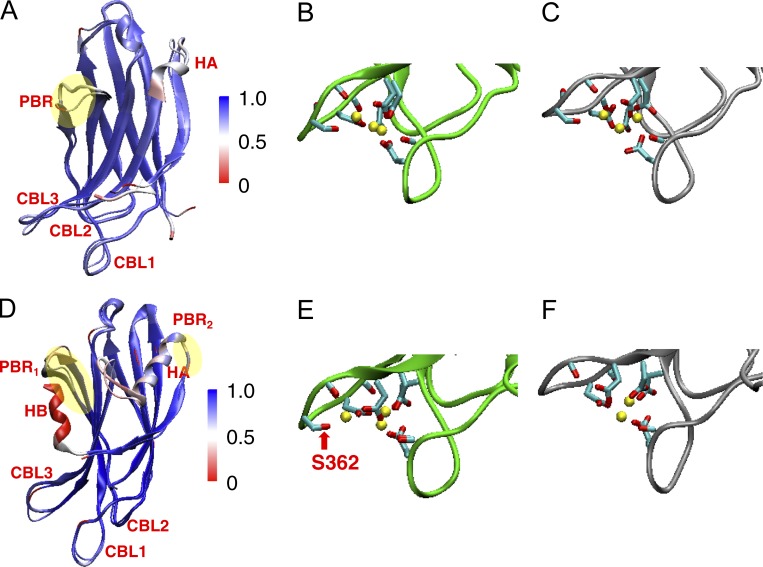
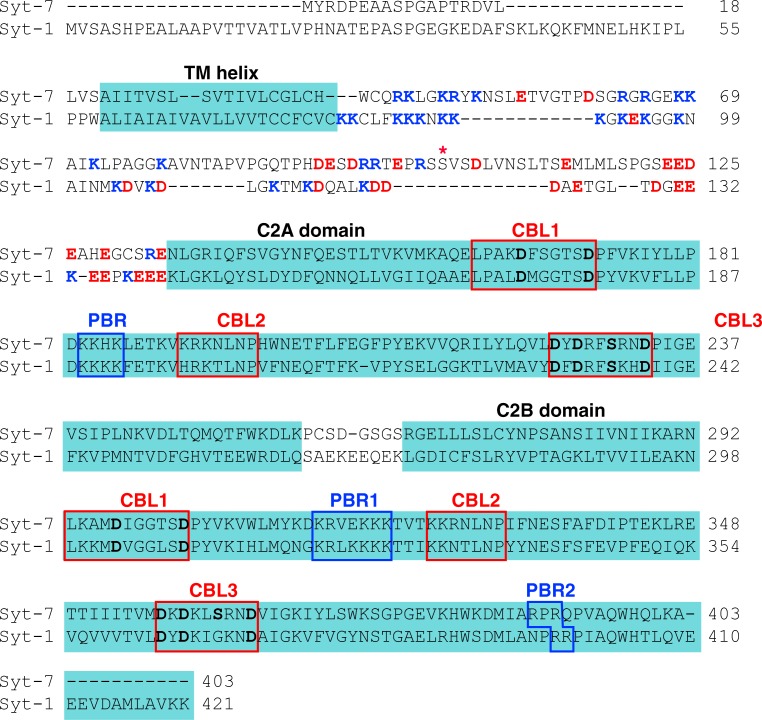
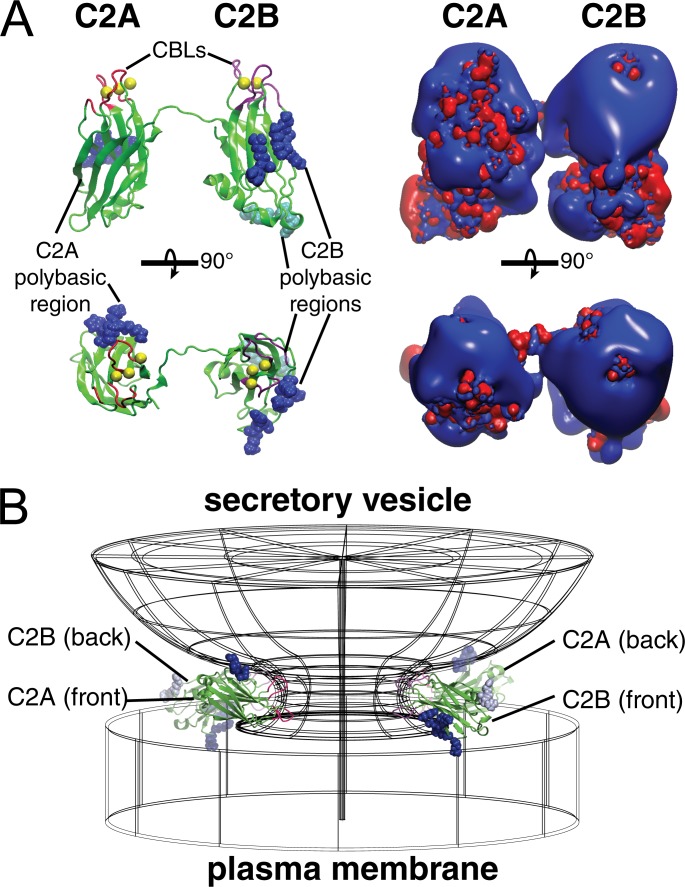
Synaptotagmin (Syt) proteins comprise a 17-member family, many of which trigger exocytosis in response to calcium. Historically, most studies have focused on the isoform Syt-1, which serves as the primary calcium sensor in synchronous neurotransmitter release. Recently, Syt-7 has become a topic of broad interest because of its extreme calcium sensitivity and diversity of roles in a wide range of cell types. Here, we review the known and emerging roles of Syt-7 in various contexts and stress the importance of its actions. Unique functions of Syt-7 are discussed in light of recent imaging, electrophysiological, and computational studies. Particular emphasis is placed on Syt-7-dependent regulation of synaptic transmission and neuroendocrine cell secretion. Finally, based on biochemical and structural data, we propose a mechanism to link Syt-7's role in membrane fusion with its role in subsequent fusion pore expansion via strong calcium-dependent phospholipid binding.


Figures

Figure 1.
Figure 1.
Syt-7 RNA-seq results from 27 human tissues. Quantitative transcriptomic analysis (RNA-seq) of Syt-7 was performed using NCBI (https://www.ncbi.nlm.nih.gov/gene/9066/?report=expression) with data obtained from Fagerberg et al. (2014), BioProject PRJEB4337, and BioProject PRJEB4337. The relative expression levels are shown in reads per kilobase per million reads placed (RPKM). RPKM is a normalized unit of specific gene transcription. Genes in different tissues were screened and scored based on total RNA level. The scores are normalized to 1 million reads (per million reads placed) to correct for the transcription activity differences in various tissues. The “per million reads placed” scores are divided by the length of the gene (per kilobase). Error bars represent SD.
Figure 2.
Figure 2.
Syt-7 is predominantly localized on large dense-core vesicles and lysosomes in PC12 cells. (A) Syt-7–expressing (green) PC12 cells show low colocalization with a plasma membrane marker, syntaxin 1A (red). (B) Representative immunofluorescence images of Syt-7 and the vesicular protein, chromogranin B (Cg, first row), or the lysosomal protein, Lamp1 (second row). (C) Graphical representation of A. (D) Graphical representation of B, demonstrating significant colocalization of Syt-7 with organelle markers. Adapted with permission from Wang et al. (2005). Error bars are ±SEM.
Figure 3.
Figure 3.
Membrane-binding kinetics of Syt-7 may explain its role in asynchronous release. (A) The C2 domains of Syt-1 and Syt-7 both bind membranes in a Ca2+-dependent manner. However, Syt-7 binds Ca2+ with much higher affinity and exhibits far slower unbinding kinetics after Ca2+ levels subside. (B) Modeled membrane binding of the two isoforms in response to a 100-Hz train of action potentials. Syt-1 rapidly releases from membranes in between action potentials, whereas Syt-7 binding continues to increase during the train. See Jackman and Regehr (2017) for modeling parameters. (C) For vesicles to fuse with the plasma membrane, they must overcome the energy barrier associated with merging the two lipid bilayers. Syt-1 (and likely Syt-7) lowers the barrier by bringing the two membranes in close apposition and inducing membrane curvature. (D) Modeling fusion rates without a contribution from Syt-1 (black line) predicts release rates that display similarities to synaptic responses recorded from Syt-1 KO neurons (adapted with permission from Bacaj et al., 2013). Syt-7 knockdown profoundly reduced release, indicating that the asynchronous release is driven mostly by Syt-7.
Figure 4.
Figure 4.
Fusion pores of Syt-7–bearing dense-core vesicles are characterized by slow expansion. (A) Time series of a pHluorin-tagged Syt-7–bearing vesicle undergoing exocytosis with associated changes in DiD-labeled membrane fluorescence (P/S and P+2S). Bar, 960 nm. The cell was periodically perfused with a low-pH (5.5) solution to verify that the fusion pore was still open (note quenching of pHluorin fluorescence at times 6.0 and 21.2 s). (B–D) Intensity-versus-time curves for images in A. The dotted black line indicates the fusion frame (time 0). Black bars indicate pH 5.5 wash. A.F.U., arbitrary fluorescence units. (E) Simulations based on P/S and P+2S fluorescence emission suggest that the fusion pore is not expanding or is expanding slowly. Modified from Rao et al. (2014).
Figure 5.
Figure 5.
The exocytotic fate of a Syt-bearing dense-core vesicle. (A) A vesicle is shown that has yet to fuse or has already fused and undergone endocytosis (i.e., from B to A). Syt-7’s N terminus is exposed to the vesicle lumen; the C2 domains are exposed to the cytosol. (B) Membrane depolarization and Ca2+ influx lead to fusion and fusion pore formation. To trigger entry into this state, the C2A (blue) and C2B (red) might both penetrate the plasma membrane (Bai and Chapman, 2004) or the C2A and C2B might interact with opposing vesicle and plasma membranes (Herrick et al., 2009). (C) The early fusion pore widens. Continued lipid association of the C2 domains may slow the expansion of the fusion pore (Bendahmane et al., 2018). (D) The C2 domains release the plasma membrane as the fusion pore expands.
Figure 6.
Figure 6.
Conservation of domain structures within the C2A and C2B domains of Syt-1 and Syt-7. (A) Superimposed experimental structures of C2A domains of Syt-7 (PDB accession no. 6ANJ) and Syt-1 (PDB accession no. 1BYN, first frame) aligned using MultiSeq (Shao et al., 1998; Roberts et al., 2006; Voleti et al., 2017). The proteins are shown in cartoon format (wider sheets for Syt-1 and narrower sheets for Syt-7) and are colored according to the Qres values, which measure the backbone structural similarity of each residue between the two aligned structures (blue for high similarity and red for low similarity). The backbone RMSD value is 1.4 Å. The polybasic region (PBR) is highlighted in yellow. The Ca2+-binding loops (CBL1–3) and helix A (HA) are labeled. (B and C) Ca2+-binding loops in Syt-7 (B) and Syt-1 (C) C2A domain experimental structures. The proteins are illustrated in cartoon format as green for Syt-7 and gray for Syt-1. The residues that coordinate the Ca2+ ions (yellow spheres) are shown as sticks (O, red; C, cyan). (D–F) are similar to A–C, but for the C2B domains of Syt-7 (PDB accession no. 3N5A) and Syt-1 (PDB accession no. 1TJX; Cheng et al., 2004; Xue et al., 2010). The backbone RMSD value is 0.9 Å. Highlighted in yellow are the two polybasic regions PBR1 and PBR2; PBR1 maps to β-strand 4 and aligns to the PBR on the C2A domains. Helix B (HB) is presented in Syt-1 and not in Syt-7. The red arrow indicates Ser362, which is present in Syt-7 and helps to coordinate the outermost Ca2+ but is missing in Syt-1.
Figure 7.
Figure 7.
Amino acid sequence comparison of Syt-7 and Syt-1. The canonical rat sequences (UniProt accession nos. Q62747-1 and P21707-1) were aligned along with the other rat synaptotagmin isoforms plus human Syt-1 and Syt-7 using Clustal Omega (Sievers et al., 2011). The human sequences (not depicted) are identical within the cytoplasmic region except for positions 66 (Ser instead of Gly), 156 (Ile instead of Val), and 325 (Met instead of Lys) of Syt-7. Transmembrane (TM) and C2 domain regions are highlighted (Lu et al., 2014). Lys/Arg (blue) and Asp/Glu (red) residues in the TM-C2A linker region are highlighted (Lai et al., 2013). The Ca2+- and membrane-binding loops (CBL) are boxed in red, with residues in bold whose side chains coordinate Ca2+. Polybasic regions boxed in blue correspond to those indicated in Fig. 6 (A and D). S103 (starred) represents a Syt-7 phosphorylation site (Wu et al., 2015).
Figure 8.
Figure 8.
Structural model for Syt stabilization of fusion pores. (A) Hypothesized relative orientation of C2A and C2B, illustrated from a composite of Syt-7 C2A (PDB accession no. 2D8K) and C2B (Xue et al., 2010) structures. Synaptotagmin C2A and C2B domains orient randomly relative to each other in solution (Choi et al., 2010), but catalysis of fusion is most efficient when the two domains point their CBLs (pink and purple; Ca2+ ions yellow) in the same direction (Bai et al., 2016), suggesting that the transition state involves the membrane-bound protein in an orientation similar to that shown here. Left: Because the C-terminal residues of the C2A domain and N-terminal residues of the C2B domain are connected by the short C2AB flexible linker, the polybasic β-4 strands orient in opposite directions, in the same way that two people standing face-to-face point their left arms in opposite directions (dark blue spheres: K183, K184, H185, K186 on C2A and K315, R316, K319, K320, K321 on C2B). A second basic cluster on C2B may also contribute to bridging as previously shown for Syt-1 (Xue et al., 2008; light blue spheres: R390 and R392). Right: Same views shown as potential maps, calculated using APBS-PDB2PQR (blue: +50 mV; red: −50 mV equipotential contours, assuming 0.15 M KCl, pH 7.4; Baker et al., 2001; Dolinsky et al., 2004). (B) Proposed locations of C2 domains during stabilization of a narrow, high-curvature fusion pore. Here the CBLs insert into the fusion pore neck and stabilize positive curvature in the plane of the pore ring, whereas the polybasic regions interact with anionic lipids on the opposing vesicle and plasma membrane surfaces. The prefusion spacing between vesicle and plasma membranes is roughly ∼2–3 Å, approximately the width of a C2 domain (Diao et al., 2012).

References

    1. Adolfsen B., Saraswati S., Yoshihara M., and Littleton J.T.. 2004. Synaptotagmins are trafficked to distinct subcellular domains including the postsynaptic compartment. J. Cell Biol. 166:249–260. 10.1083/jcb.200312054 - DOI - PMC - PubMed
    1. Albillos A., Dernick G., Horstmann H., Almers W., Alvarez de Toledo G., and Lindau M.. 1997. The exocytotic event in chromaffin cells revealed by patch amperometry. Nature. 389:509–512. 10.1038/39081 - DOI - PubMed
    1. Alés E., Tabares L., Poyato J.M., Valero V., Lindau M., and Alvarez de Toledo G.. 1999. High calcium concentrations shift the mode of exocytosis to the kiss-and-run mechanism. Nat. Cell Biol. 1:40–44. 10.1038/9012 - DOI - PubMed
    1. Allersma M.W., Wang L., Axelrod D., and Holz R.W.. 2004. Visualization of regulated exocytosis with a granule-membrane probe using total internal reflection microscopy. Mol. Biol. Cell. 15:4658–4668. 10.1091/mbc.e04-02-0149 - DOI - PMC - PubMed
    1. Allersma M.W., Bittner M.A., Axelrod D., and Holz R.W.. 2006. Motion matters: Secretory granule motion adjacent to the plasma membrane and exocytosis. Mol. Biol. Cell. 17:2424–2438. 10.1091/mbc.e05-10-0938 - DOI - PMC - PubMed

Publication types

LinkOut - more resources