. 2018 May 23;9(1):2028.
doi: 10.1038/s41467-018-04334-1.

Profiling human breast epithelial cells using single cell RNA sequencing identifies cell diversity

Affiliations

Profiling human breast epithelial cells using single cell RNA sequencing identifies cell diversity

Quy H Nguyen et al. Nat Commun. .

Abstract

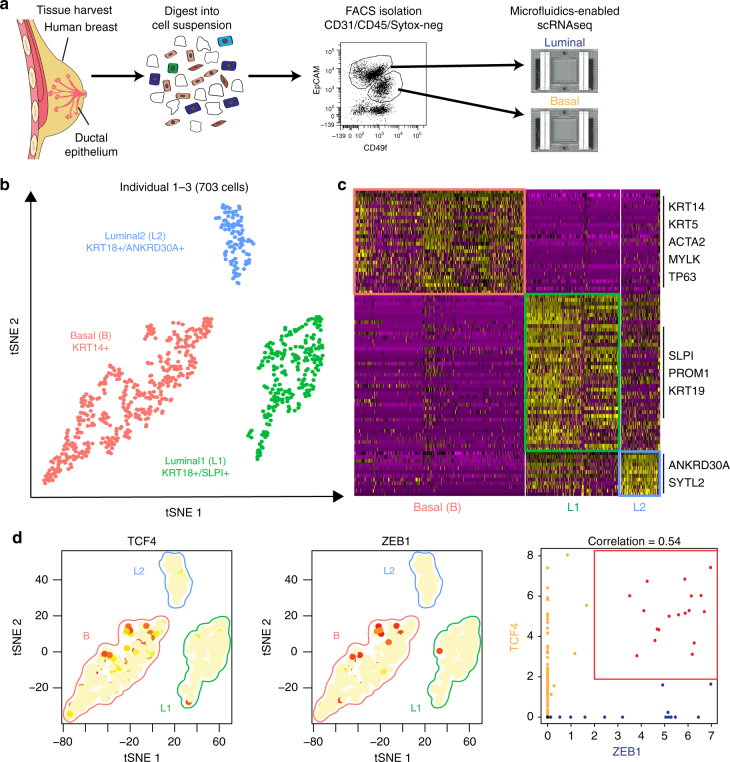
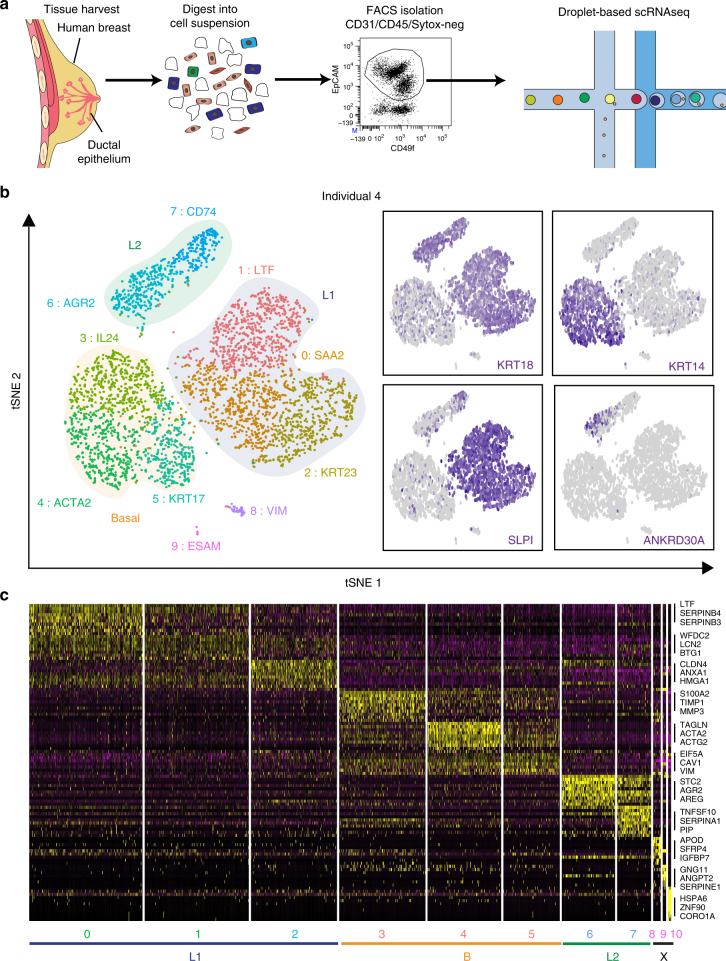
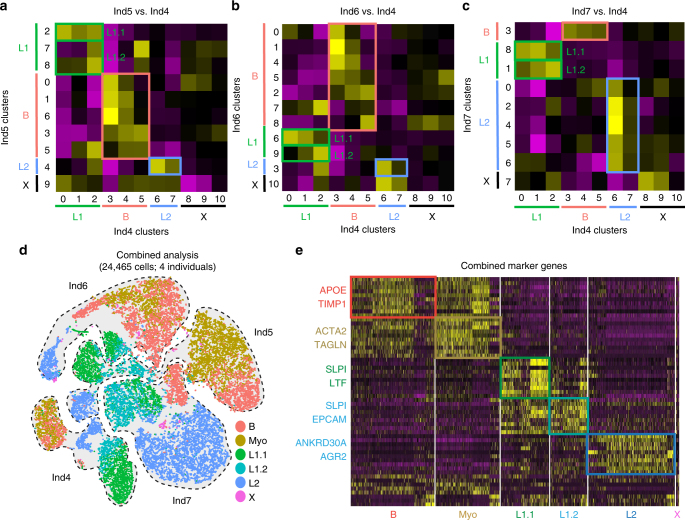
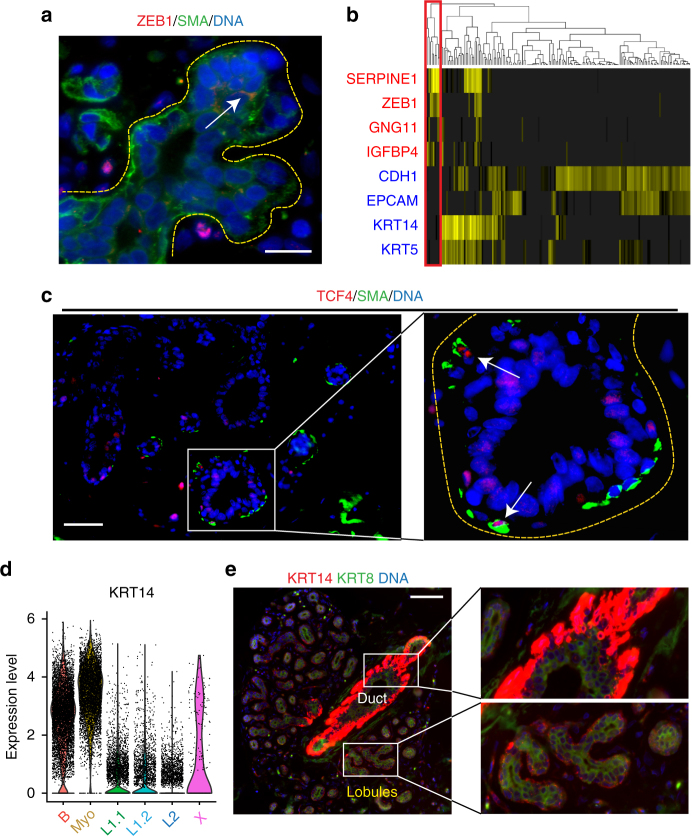
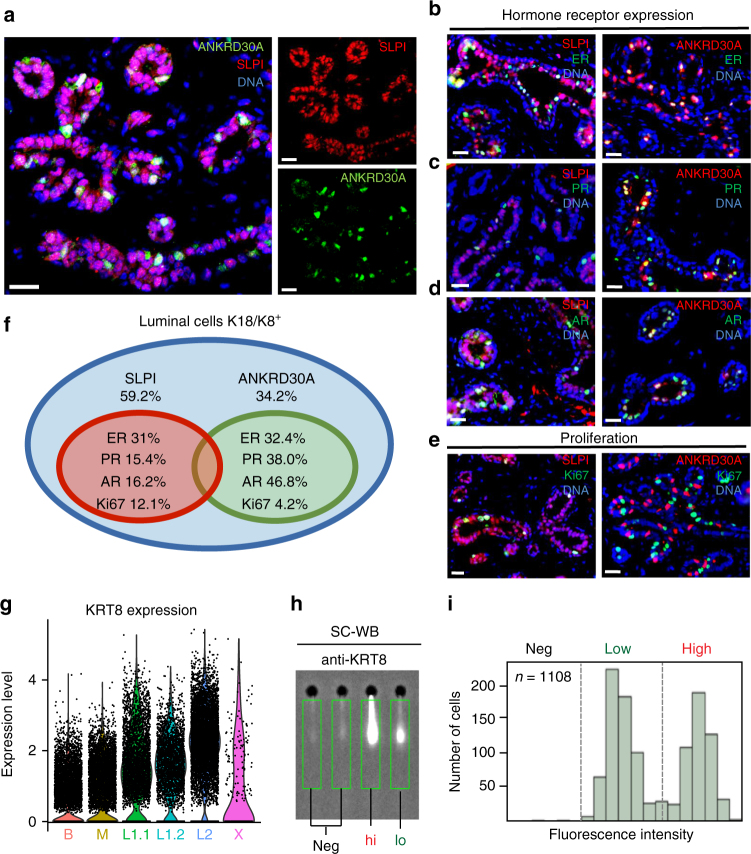
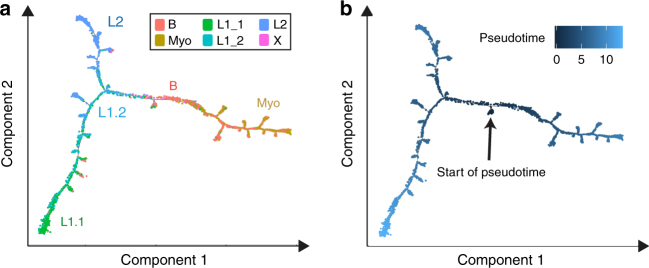
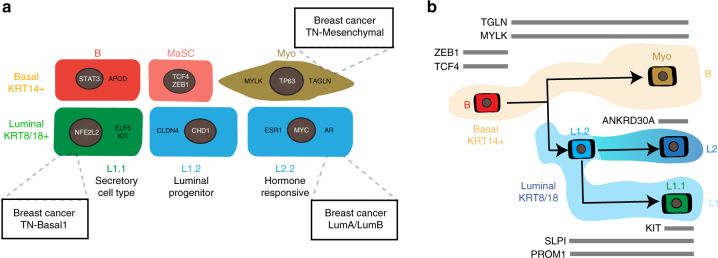
Breast cancer arises from breast epithelial cells that acquire genetic alterations leading to subsequent loss of tissue homeostasis. Several distinct epithelial subpopulations have been proposed, but complete understanding of the spectrum of heterogeneity and differentiation hierarchy in the human breast remains elusive. Here, we use single-cell mRNA sequencing (scRNAseq) to profile the transcriptomes of 25,790 primary human breast epithelial cells isolated from reduction mammoplasties of seven individuals. Unbiased clustering analysis reveals the existence of three distinct epithelial cell populations, one basal and two luminal cell types, which we identify as secretory L1- and hormone-responsive L2-type cells. Pseudotemporal reconstruction of differentiation trajectories produces one continuous lineage hierarchy that closely connects the basal lineage to the two differentiated luminal branches. Our comprehensive cell atlas provides insights into the cellular blueprint of the human breast epithelium and will form the foundation to understand how the system goes awry during breast cancer.


Conflict of interest statement

The authors declare no competing interests.

Figures

Fig. 1
Fig. 1
Identification of three major epithelial cell types and their markers using scRNAseq. a Overview of scRNAseq approach using primary human breast tissue samples that were processed into single cell suspension, followed by FACS isolation of basal (CD49f-hi, EPCAM+) and luminal (CD49f+, EPCAM-hi), and scRNAseq analysis using the microfluidics-enabled scRNAseq. b Combined tSNE projection of cells from all three microfluidics-enabled scRNAseq datasets. The major basal cluster is highlighted in red; Luminal1 (L1) in green; Luminal2 (L2) in blue. c Heatmap displaying the scaled expression patterns of top marker genes within each cell type with selected marker genes highlighted; yellow indicating high expression of a particular gene, and purple indicating low expression. d Feature plots showing the scaled expression of TCF4 and ZEB1 marking a subpopulation of basal cells and gene plot showing co-expression of TCF4 and ZEB1 in the same cells. See Supplementary Fig. 1 capture site imaging, gene detection, individual principal component analysis, tSNE plot colored by individual-derived cells and feature plots of cell type-specific markers
Fig. 2
Fig. 2
High throughput droplet-mediated scRNAseq reveals additional epithelial cell states. a Overview for droplet-enabled scRNAseq approach as described above; basal and luminal epithelial cells were sorted together and subjected to combined scRNAseq analysis using the droplet-based scRNAseq. b Data from individual four was analyzed using Seurat and the distinct clusters (0–10) are displayed in tSNE projection with selected marker gene for each cluster, and main epithelial cell types (Basal, L1, L2) are outlined. Feature plots of characteristic markers for the three main cell types are shown on the right showing expression levels as gradient of purple. c Heatmap showing the top ten marker genes for each cluster as determined by Seurat analysis with three selected genes per cluster highlighted on the right. See Supplementary Fig. 2 for individual clustering and marker gene analyses for Individuals 5–7
Fig. 3
Fig. 3
Combined droplet based RNAseq data to identify generalizable cell types and states. ac Heatmaps showing gene scoring results using marker genes for Ind4 clusters (0–10; on bottom of heatmap) in all clusters from Ind5 (a), Ind6 (b), and Ind7 (c). Individual-specific cluster IDs are shown in different colors on the right and bottom, and cell type IDs for Basal (b), L1, L2, X are indicated on for every cluster. Data shown as Z scores from purple (low) to yellow (high). Two distinct cell states L1.1 and L1.2 were found within L1 in all pairwise comparisons as highlighted by colored boxes on heatmap. d Combined tSNE projection of all individual datasets (outlined) is shown including the cell state identity marked by different colors. e Heatmap showing the expression pattern of the top ten markers per cell state with selected markers indicated (yellow = high expression; purple = low expression). See Supplementary Fig. 4 for separate basal cell Seurat analysis, summary of cell state designations and Ingenuity Pathway Analysis
Fig. 4
Fig. 4
Characterization and spatial integration of basal cell states. a Immunofluorescence analysis of ZEB1 protein expression (red) in combination with basal marker KRT14 (green) and DNA stain using DAPI (blue) within tissue sections from primary human reduction mammoplasty samples showing ZEB1 expression in a subpopulation of basal (KRT14+) cells. Scale bar = 15 µm. b Heatmap showing expression of genes previously shown to be up- (red) or down-regulated (blue) in a population of PROCR+ mammary stem cells show correlation with ZEB1+ cells in scRNAseq. c Immunofluorescence analysis of TCF4 protein expression (red) in combination with basal marker SMA (green) and DNA stain using DAPI (blue) within tissue sections from primary human reduction mammoplasty samples revealed that TCF4 is expressed in a subpopulation of basal (SMA+) cells. Scale bar = 25 µm. d Violin plot for expression of KRT14 by cell state showing highest expression in the myoepithelial (Myo) cells. e KRT14 and KRT8 double immunostaining revealed highest expression of KRT14 in ductal basal cells, while lobular basal cells show more diverse KRT14 positivity. Scale bar = 75 µm. See Supplementary Fig. 4 for violin plots displaying selected myoepithelial gene expression and identification of KRT8/KRT14 double positive cells
Fig. 5
Fig. 5
Validation and spatial integration of two distinct luminal cell types. a Immunofluorescence analysis of NY-BR-1 protein expression (green) in combination with basal marker SLPI (red) and DNA stain using DAPI (blue) within tissue sections from primary human reduction mammoplasty samples revealed that NY-BR-1 and SLPI are markers for distinct luminal subpopulations. be Immunofluorescence analysis of NY-BR-1 and SLPI (red) protein expression with: hormone receptors for estrogen receptor (b), progesterone (c), and androgen (d) and proliferation marker Ki67 e in green. f Summary of hormone receptor and proliferation marker expression in L1 and L2 cells. g Violin plot showing expression of KRT8 in the luminal subpopulations, higher expression is seen in the luminal L1.1 and L1.2 subpopulation. h Sample frame for detection of KRT8 protein content from individual cells using single cell Western blot following detection using microarray scanner. i Population summary showing cell number per fluorescence intensity confirmed bimodal distribution of KRT8 expression on the protein level. See Supplementary Fig. 5 for violin plots displaying expression of relevant hormone receptors as well as proliferation and luminal progenitor markers. All scale bars = 25 µm
Fig. 6
Fig. 6
Reconstruction of differentiation and relation of cell states to breast cancer subtypes. a Monocle-generated pseudotemporal trajectory of a subsampled population of cells (n = 4000) from four individuals analyzed using droplet-mediated scRNAseq is shown colored by cell state designation. b Pseudotime is shown colored in a gradient from dark to light blue and start of pseudotime is indicated. See Supplementary Fig. 6 for summary list of discovered cell states, Monocle analysis of microfluidics-enabled scRNAseq results and gene scoring for breast cancer subtypes
Fig. 7
Fig. 7
Proposed cellular heterogeneity and lineage hierarchies within the human breast. a Schematic summary of discovered cell states within the basal and luminal compartment of the human breast epithelium with proposed function, key transcription factors (in white), selected markers (in black) and similarities to breast cancer subtypes indicated in boxes. b Proposed model summarizing the lineage hierarchies within the breast epithelium based on one continuous differentiation trajectory from basal stem cells to three distinct differentiated cell types with overlaid marker genes of interest shown (black on gray bars)

References

    1. Perou CM, et al. Molecular portraits of human breast tumours. Nature. 2000;406:747–752. doi: 10.1038/35021093. - DOI - PubMed
    1. Eroles P, Bosch A, Perez-Fidalgo JA, Lluch A. Molecular biology in breast cancer: intrinsic subtypes and signaling pathways. Cancer Treat. Rev. 2012;38:698–707. doi: 10.1016/j.ctrv.2011.11.005. - DOI - PubMed
    1. Ali HR, et al. Genome-driven integrated classification of breast cancer validated in over 7,500 samples. Genome Biol. 2014;15:431. doi: 10.1186/s13059-014-0431-1. - DOI - PMC - PubMed
    1. Visvader JE, Stingl J. Mammary stem cells and the differentiation hierarchy: current status and perspectives. Genes Dev. 2014;28:1143–1158. doi: 10.1101/gad.242511.114. - DOI - PMC - PubMed
    1. Shackleton M, et al. Generation of a functional mammary gland from a single stem cell. Nature. 2006;439:84–88. doi: 10.1038/nature04372. - DOI - PubMed

Publication types

Substances