. 2018 May 23;8(1):8043.
doi: 10.1038/s41598-018-26239-1.

A 2-transcript host cell signature distinguishes viral from bacterial diarrhea and it is influenced by the severity of symptoms

Affiliations

A 2-transcript host cell signature distinguishes viral from bacterial diarrhea and it is influenced by the severity of symptoms

R Barral-Arca et al. Sci Rep. .

Abstract

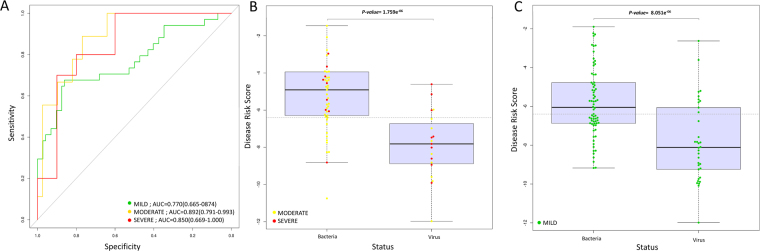
Recently, a biomarker signature consisting of 2-transcript host RNAs was proposed for discriminating bacterial from viral infections in febrile children. We evaluated the performance of this signature in a different disease scenario, namely a cohort of Mexican children (n = 174) suffering from acute diarrhea of different infectious etiologies. We first examined the admixed background of the patients, indicating that most of them have a predominantly Native American genetic ancestry with a variable amount of European background (ranging from 0% to 57%). The results confirm that the RNA test can discriminate between viral and bacterial causes of infection (t-test; P-value = 6.94×10⁻¹¹; AUC = 80%; sensitivity: 68% [95% CI: 55%-79%]; specificity: 84% [95% CI: 78%-90%]), but the strength of the signal differs substantially depending on the causal pathogen, with the stronger signal being that of Shigella (P-value = 3.14 × 10⁻¹²; AUC = 89; sensitivity: 70% [95% CI: 57%-83%]; specificity: 100% [95% CI: 100%-100%]). The accuracy of this test improves significantly when excluding mild cases (P-value = 2.13 × 10⁻⁶; AUC = 85%; sensitivity: 79% [95% CI: 58%-95%]; specificity: 78% [95% CI: 65%-88%]). The results broaden the scope of previous studies by incorporating different pathogens, variable levels of disease severity, and different ancestral background of patients, and add confirmatory support to the clinical utility of these 2-transcript biomarkers.


Conflict of interest statement

The authors declare no competing interests.

Figures

Figure 1
Figure 1
Ancestry analysis of RNA samples based on SNP data. (A) Barplot of maximum likelihood estimations of individual ancestries, indicating that most patients have a main Native American ancestry, while European ancestry is present in a few of them with values ranging from 0% to 57.7%. (B) MDS plot of pairwise individual IBS values showing that the genome profile of patients and controls (labeled in the figure as control, bacteria and rotavirus) falls close to the Native America cluster (identified by several population samples of Native American ethnic origin), and some of the samples slightly displaced towards the European pole represented by CEU in Dimensions 1 and 2.
Figure 2
Figure 2
Classification performance based on the 2-transcript DRS combined as [log2(FAM89expresion)–log2(ILF44Lexpression)]. (A) Box and whisker plot of DRS: the horizontal lines in the boxes indicate the median of each group; the lower and upper edges of boxes reflect interquartile ranges, and the whiskers are <1 times the interquartile range; the horizontal grey line is the DRS threshold that maximizes the AUC when comparing patients with viral and bacterial infections. (B) ROC curves of different bacteria compared to rotavirus; the different colors identify the type of bacteria according to the inset legend. AUC values are provided in Table 1.
Figure 3
Figure 3
Classification performance based on the 2-transcript DRS combined as [log2(FAM89expresion)–log2(ILF44Lexpression)] and considering different levels of severity. (A) ROC curves of different bacteria compared to rotavirus; AUC values by pathogen are provided in Table 1; and (B) and (C) box and whisker plots of DRS for moderate plus severe cases and mild cases, respectively.

References

    1. Brown ED, Wright GD. Antibacterial drug discovery in the resistance era. Nature. 2016;529:336–343. doi: 10.1038/nature17042. - DOI - PubMed
    1. Llor C, Bjerrum L. Antimicrobial resistance: risk associated with antibiotic overuse and initiatives to reduce the problem. Ther. Adv. Drug. Saf. 2014;5:229–241. doi: 10.1177/2042098614554919. - DOI - PMC - PubMed
    1. Gliddon HD, Herberg JA, Levin M, Kaforou M. Genome-wide host RNA signatures of infectious diseases: discovery and clinical translation. Immunology. 2018;153:171–178. doi: 10.1111/imm.12841. - DOI - PMC - PubMed
    1. Mahajan P, et al. Association of RNA biosignatures with bacterial infections in febrile infants aged 60 days or younger. JAMA. 2016;316:846–857. doi: 10.1001/jama.2016.9207. - DOI - PMC - PubMed
    1. Herberg JA, et al. Diagnostic test accuracy of a 2-transcript host RNA signature for discriminating bacterial vs viral infection in febrile children. JAMA. 2016;316:835–845. doi: 10.1001/jama.2016.11236. - DOI - PMC - PubMed

Publication types

MeSH terms