. 2019 Mar;26(3):455-469.
doi: 10.1038/s41418-018-0130-7. Epub 2018 May 23.

NFκB mitigates the pathological effects of misfolded α1-antitrypsin by activating autophagy and an integrated program of proteostasis mechanisms

Affiliations

NFκB mitigates the pathological effects of misfolded α1-antitrypsin by activating autophagy and an integrated program of proteostasis mechanisms

Amitava Mukherjee et al. Cell Death Differ. 2019 Mar.

Abstract

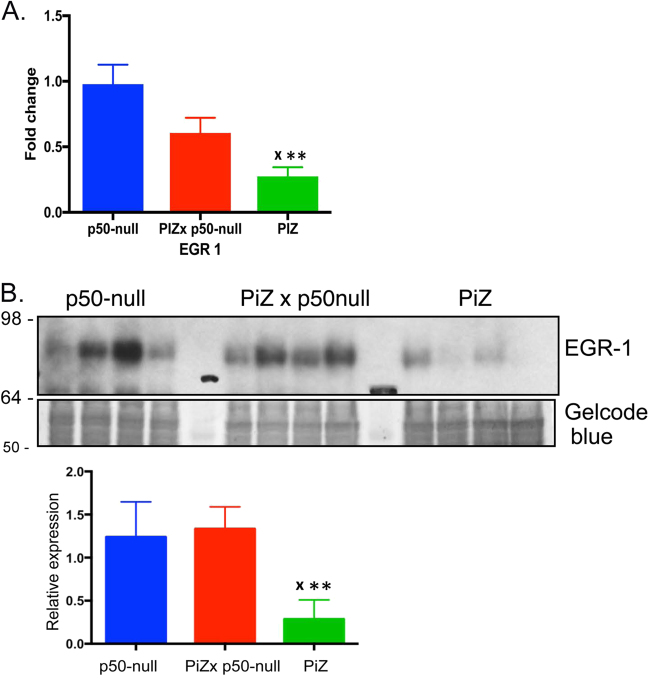
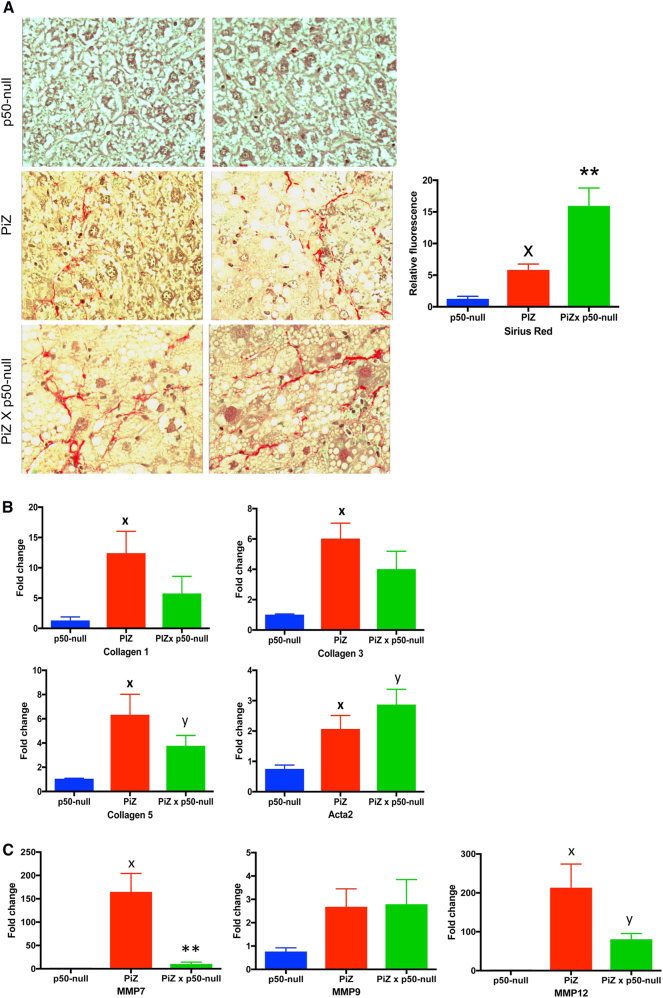
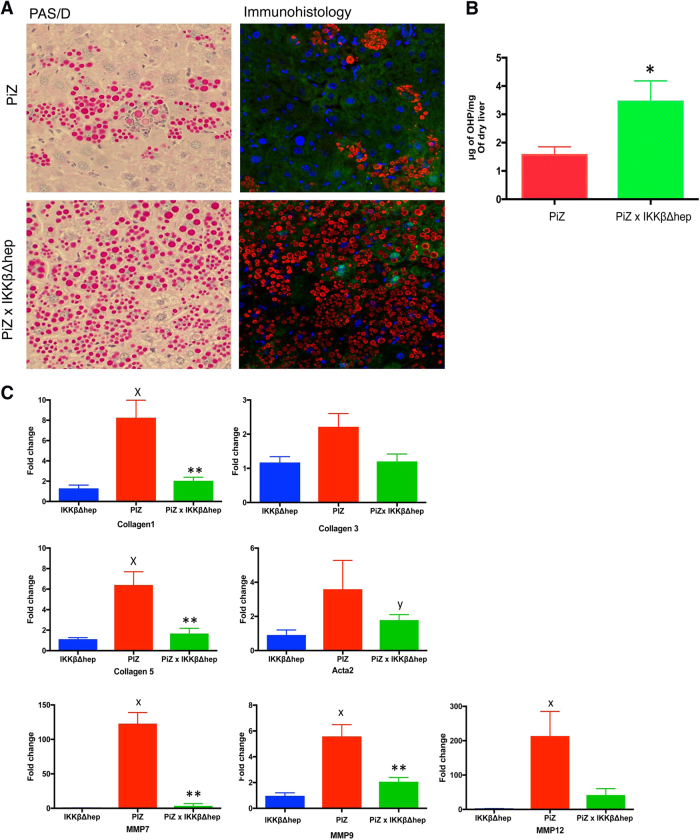
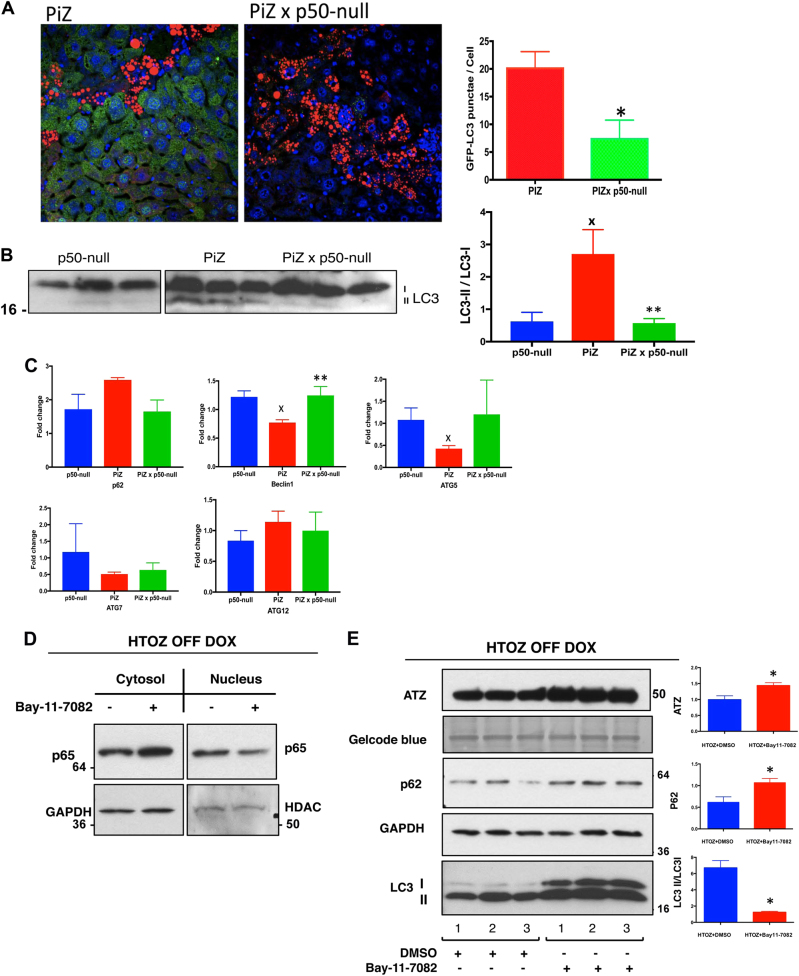
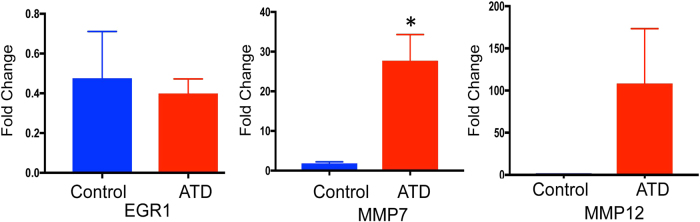
Intrahepatocytic accumulation of misfolded α1-antitrypsin Z variant (ATZ) is responsible for liver disease in some individuals with α1-antitrypsin deficiency (ATD), characterized by fibrosis/cirrhosis and predisposition to carcinogenesis. Previous results showing that accumulation of ATZ in model systems activates the NFκB signaling pathway have led us to hypothesize that downstream targets of NFκB are elements of a proteostasis response network for this type of proteinopathy. Here we show that only a subset of downstream targets within the NFκB transcriptomic repertoire are activated in model systems of this proteinopathy. Breeding of the PiZ mouse model of ATD to two different mouse models with NFκB deficiency led to greater intrahepatocytic accumulation of ATZ, more severe hepatic fibrosis, decreased autophagy and hyperproliferation of hepatocytes with massive ATZ inclusions. Specific downstream targets of NFκB could be implicated in each pathological effect. These results suggest a new role for NFκB signaling in which specific downstream targets of this pathway mediate an integrated program of proteostatic responses designed to mitigate the pathologic effects of proteinopathy, including autophagic disposal of misfolded protein, degradation of collagen and prevention of hyperproliferation.


Conflict of interest statement

The authors declare no conflicts of interest.

Figures

Fig. 1
Fig. 1
Activation of NFκB and downregulation of Egr1 in the liver of the PiZ mouse model. a Transcriptional changes in the Z mouse model with liver-specific inducible expression of ATZ compared to known downstream targets of NFκB. In the left column genes that are known downstream targets of NFκB are listed and the arrow indicates whether the expression of each gene is increased or decreased by the action of NFκB in conventional inflammatory states. In the right column results of RT-PCR show whether these genes in gene expression occur in the liver of the Z mouse with liver-specific inducible expression [2] when ATZ expression is induced by withdrawal of doxycycline from the drinking water (+ indicates that the change in expression is reproduced in the Z mouse liver when ATZ gene expression is induced; − indicates that there is no change in expression of the gene when ATZ gene expression is induced in the Z mouse). NS indicates no significant difference. b NFκB DNA-binding activity in PiZ and C57 (C57/BL6) mouse liver was assayed by electrophoretic mobility shift assay and the specific gel shift band was analyzed by densitometric scanning. Results are shown as mean ± SE for n = 3 mice each, p < 05. Asterisk indicates statistical significance from C57. c Chromatin immunoprecipitation assay in PiZ and C57 (C57/BL6) liver using antibodies to p50, p65, and non-specific IgG. c Expression of Egr1 in PiZ and C57 (C57/BL6) liver by RT-PCR. d Expression of Egr1 in PiZ and control (FVB/N) liver by QPCR. Results are shown as mean ± SE for n = 3 mice each, p < 0.01. Asterisk indicates statistical significance from control
Fig. 2
Fig. 2
Activation of NFκB and downregulation of Egr1 in the HTO/Z cell line model. a NFκB DNA-binding activity in HTO/Z and control HTO/M cell line was assayed by electrophoretic mobility shift assay and the specific gel shift band was analyzed by densitometric scanning. Results are shown as mean ± SE for n = 3 biological replicates each, p < 01. b Immunoblot analysis for steady-state levels of ATZ, Egr1, and GAPDH in the HTO/Z cell line in the presence or absence of dox with relative densitometic intensity for Egr1 shown on the right in mean ± SE, p < 0.05. c Immunoblot analysis for steady-state levels of Egr1 in HTO/M and HTO/Z cell line in the absence of dox. Gelcode blue staining was used as a loading control. Results of densitometric scanning is shown at the right of b and c as mean ± SE, p < 0.05 for n = 3 biological replicates. Asterisk indicates statistical significance from control
Fig. 3
Fig. 3
Expression of Egr1 in PiZ × p50-null mouse liver. a QPCR. Results are shown as mean ± SE for n = 3 biological replicates each. Single asterisk indicates statistical significance for PiZ versus p50-null (p < 0.01) and double asterisk indicates statistical significance for PiZ × p50-null versus PiZ (p < 0.05). b Immunoblot analysis with densitometric scanning results at right. Gelcode blue staining is used as loading control. x indicates statistical significance for PiZ versus p50-null (p < 0.01) and double asterisk indicates statistical significance for PiZ versus PiZ × p50-null (p < 0.01) for n = 4 biological replicates
Fig. 4
Fig. 4
Hepatic ATZ accumulation and hepatocyte proliferation in the PiZ × p50-null mouse compared to the PiZ mouse (n = 3 each). a PAS/D staining with quantitative morphometric analysis shown as mean ± SE for number of globules, area of globules and size of globules. Asterisk indicates statistical significance for PiZ (p < 0.05 for number of globules and p < 0.05 for area of globules). b Double staining for PAS/D and BrdU with quantitative morphometry. The histogram on the left shows globule containing cells with BrdU+ in red and BrdU− in blue. The histogram on the right shows BrdU+ cells with globule containing cells in red and globule-devoid cells in blue
Fig. 5
Fig. 5
Fibrotic response in PiZ × p50-null mouse liver compared to PiZ. a Sirius red staining with quantitative morphometry for p50-null, PiZ and PiZ × p50-null mice. On the left, examples of stained sections from two mice in each group is shown. On the right quantitative morphometry for n = 3 mice from each group is shown with x indicating statistical significance for PiZ vs p50-null and double asterisks indicating statistical significance for PiZ × p50-null vs PiZ (p < 0.01) b and c, expression by QPCR of collagen genes and collagen-degrading matrix metallproteases, respectively (n = 3 each group). x indicates significant difference for PiZ compared to p50-null; double asterisks indicate significant difference for PiZ × p50-null compared to PiZ; y indicates significance for PiZ × p50-null compared to p50-null
Fig. 6
Fig. 6
Hepatic ATZ accumulation and fibrotic response in PiZ × IKKβ∆hep mouse compared to PiZ mouse. a Staining of liver sections with PAS/D (left) and anti-AT antibody (Immunohistology—right); b Hepatic hydroxyproline content, n = 3 for each group. Asterisk indicates statistical signifcance (p < 0.05); c Expression of collagen and collagen-degrading metalloproteases by QPCR, n = 3 for each group. x indicates significant difference for PiZ compared to IKKβΔhep; double asterisk indicates significant difference for PiZ × IKKβΔhep compared to PiZ; y indicates significant difference for PiZ × IKKβΔhep compared to IKKβΔhep
Fig. 7
Fig. 7
Effect of NFκB deficiency on hepatic autophagic response in PiZ × p50-null mice and of NFκB inhibition in the HTO/Z cell line model. a Immunostaining of GFP+ autophagosomes. Quantification of GFP-LC3 puncta per cell is shown as mean ± SE for n = 3 each. Asterisk indicates statistical significance (p < 0.05). b Immunoblot analysis for LC3 isoforms in the liver of the p50-null, PiZ and PiZ × p50-null mice with relative densitometric analysis. x indicates statistical significance for PiZ compared to p50-null and double asterisk indicates statistical significance for PiZ × p50-null compared to PiZ (p < 0.05); c Expression of autophagy genes in the liver of the PiZ × p50-null vs PiZ and vs p50-null mice using qRT-PCR is shown as fold-change (mean ± SE for n = 3 each). x indicates statistical significance for PiZ vs p50-null and double asterisks indicate statistical significance for PiZ × p50-null compared to PiZ. d Effect of Bay 11-7082 on NFκB p65, ATZ, p62, and LC3 isoform levels in HTO/Z cell line. Asterisk indicates statistical significance (p < 0.05 for ATZ, p < 0.05 for p62 and p < 0.01 for LC3-II to LC3-I ratio)
Fig. 8
Fig. 8
Expression of NFκB target genes Egr1, MMP7, and MMP12 in livers from ATD patients (n = 5) and normal controls (n = 7) by qRT-PCR. Results are shown as fold change (mean ± SE). Asterisk indicates statistically significant difference

References

    1. Ghouse R, Chu A, Wang Y, Perlmutter DH. Mysteries of α1-antitrypsin deficiency: emerging therapeutic strategies for a challenging disease. Dis Model Mech. 2014;4:411–9. doi: 10.1242/dmm.014092. - DOI - PMC - PubMed
    1. Hidvegi T, Mirnics K, Hale P, Ewing M, Beckett C, Perlmutter DH. Regulator of G signaling 16 is a marker for the distinct ER stress state associated with aggregated mutant α1-antitrypsin Z in the classical form of α1-antitrypsin deficiency. J Biol Chem. 2007;282:27769–80. doi: 10.1074/jbc.M704330200. - DOI - PubMed
    1. Rudnick DA, Perlmutter DH. Alpha-1-antitrypsin deficiency: a new paradigm for hepatocellular carcinoma in genetic liver disease. Hepatology. 2005;42:514–21. doi: 10.1002/hep.20815. - DOI - PubMed
    1. Rudnick DA, Liou Y, An JK, Muglia LJ, Perlmutter DH, Teckman H. Analyses of hepatocellular proliferation in a mouse model of alpha-1-antitrypsin deficiency. Hepatology. 2004;39:1048–55. doi: 10.1002/hep.20118. - DOI - PubMed
    1. Ding J, Yannam GR, Roy-Chowdhury N, Hidvegi T, Basma H, Rennard SI, et al. Spontaneous hepatic repopulation in transgenic mice expressing mutant human α1-antitrypsin by wild-type donor hepatocytes. J Clin Invest. 2011;121:1930–4. doi: 10.1172/JCI45260. - DOI - PMC - PubMed

Publication types

MeSH terms