. 2018 May 23;8(1):8028.
doi: 10.1038/s41598-018-26176-z.

Cholinergic activity is essential for maintaining the anterograde transport of Choline Acetyltransferase in Drosophila

Affiliations

Cholinergic activity is essential for maintaining the anterograde transport of Choline Acetyltransferase in Drosophila

Swagata Dey et al. Sci Rep. .

Abstract

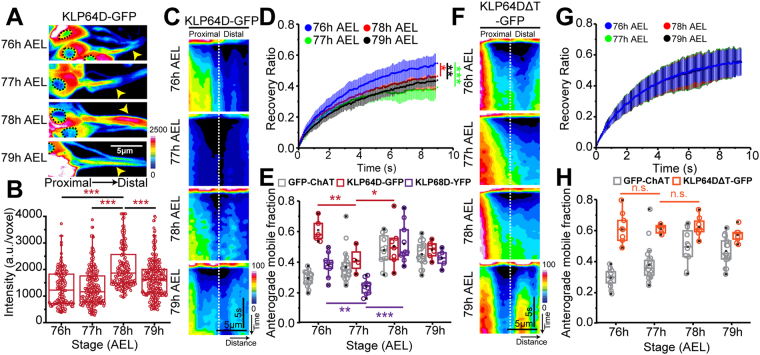
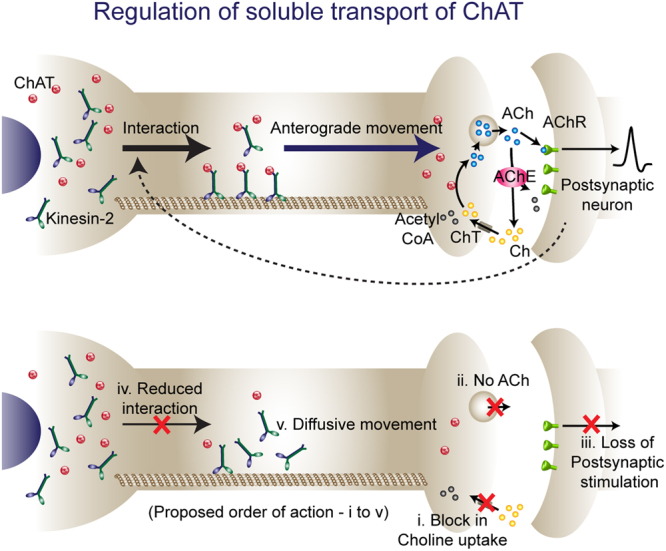
Cholinergic activity is essential for cognitive functions and neuronal homeostasis. Choline Acetyltransferase (ChAT), a soluble protein that synthesizes acetylcholine at the presynaptic compartment, is transported in bulk in the axons by the heterotrimeric Kinesin-2 motor. Axonal transport of soluble proteins is described as a constitutive process assisted by occasional, non-specific interactions with moving vesicles and motor proteins. Here, we report that an increase in the influx of Kinesin-2 motor and association between ChAT and the motor during a specific developmental period enhances the axonal entry, as well as the anterograde flow of the protein, in the sensory neurons of intact Drosophila nervous system. Loss of cholinergic activity due to Hemicholinium and Bungarotoxin treatments, respectively, disrupts the interaction between ChAT and Kinesin-2 in the axon, and the episodic enhancement of axonal influx of the protein. Altogether, these observations highlight a phenomenon of synaptic activity-dependent, feedback regulation of a soluble protein transport in vivo, which could potentially define the quantum of its pre-synaptic influx.


Conflict of interest statement

The authors declare no competing interests.

Figures

Figure 1
Figure 1
Role of Kinesin-2 in the episodic anterograde flow of ChAT in lch5 axons. (A) Pseudocolored images depict the levels of GFP-ChAT fluorescence in different regions of the lch5 neurons in the wild-type and Klp64Dk1/A8.n123 (Klp64D−/−) mutant backgrounds. The axons (yellow arrowhead) and dendrites (white arrowhead) are indicated in each panel. The right panels indicated magnified views of the axonal bundles. (B) Quantification of GFP-ChAT fluorescence in the cell body and proximal axonal segments of lch5 neurons in the wild-type and Klp64Dk1/A8.n123 (Klp64D−/−) mutant larvae. (C) Schematic showing the relative position of the axon segment of a lch5 neuron used for the FRAP assay, and kymographs depict the FRAP profiles of GFP-ChAT measured from the 10 µm axon segment during 76–79 h AEL in the wild-type and Klp64D−/− backgrounds. (D,E) The average (±S.D.) recovery ratios of GFP-ChAT fluorescence (relative recovery) at the proximal and distal segments of the photobleached axonal region in wild-type (D) and Klp64D−/− (E) backgrounds (N ≥ 5). (F,G) Box and scatter plots depict maximum mobile fractions estimated from the FRAP profiles of the proximal and distal segments of wild-type (F) and Klp64D−/− (G) neurons expressing GFP-ChAT. The pair-wise significance of differences was estimated using one-way ANOVA, and the p-values < 0.05 (*), and < 0.001 (***) are indicated on the panels.
Figure 2
Figure 2
Flow characteristics of Kinesin-2 motor subunits in lch5 axons. (A,B) Pseudocolored intensity-heat-map images (A), average fluorescence intensities (B) of KLP64D-GFP depict the relative distribution of the recombinant motor in the lch5 neurons. Black dotted perimeter outlines nuclei in each neuron, and yellow arrowheads show the axons. Intensities in the 10 μm proximal segment of lch5 axons were estimated at different stages of development. (C) KLP64D-GFP FRAP kymographs, obtained during 76–79 h AEL from the 10 µm axon segment of lch5 neurons (schematic, Fig. 1C), and presented in the pseudo-colored intensity-heat-map. (D) Relative recovery profiles of KLP64D-GFP FRAP during 76–79 h AEL (N ≥ 6). (E) The maximum anterograde mobile fraction obtained from the single exponential fit of the FRAP profiles of GFP-ChAT (gray), and KLP64D-GFP (red), and KLP68D-YFP (purple) in the proximal axon segments of lch5 neurons. (F) KLP64DΔT-GFP FRAP kymographs depict relative recovery of fluorescence during 76–79 h AEL in the 10 µm axonal segments of lch5 neurons. (G,H) Relative recovery profiles of KLP64DΔT-GFP FRAP during 76–79 h AEL (G), and maximum anterograde mobile fractions obtained from the single exponential fits of the FRAP profiles of KLP64DΔT-GFP (orange) and GFP-ChAT (gray)(H). The pairwise significance of differences was estimated using one-way ANOVA and the p-values (ns, * < 0.05, ** < 0.01, *** < 0.001) are indicated on the panel.
Figure 3
Figure 3
An estimate of the dynamic association between ChAT and Kinesin-2 in lch5 axons during transport at different developmental stages. (A) Schematic illustrates the sFRET assay principle adopted to measure dynamic interactions between TQ-ChAT and KLP68D-YFP subunit of Kinesin-2. (B) TQ-ChAT accumulation in the lch5 axon segment during 76–79 h AEL. (C) Raw images (TQ, YFP, and sFRET channels) obtained from the lch5 neurons expressing TQ-ChAT/KLP68D-YFP and TQ/sYFP (control) pairs respectively during 76–79 h AEL. Note the increase observed in the FRET channel at 78 h AEL (white arrows). (D) The combined box and scatter plots depict sFRET ratios in the axon segments obtained from the TQ-ChAT/KLP68D-YFP and TQ/sYFP backgrounds during 76–79 h AEL. The pairwise significance of differences was estimated using one-way ANOVA and the p-values (ns, * < 0.05, ** < 0.01, *** < 0.001) are indicated on the panel.
Figure 4
Figure 4
Effects of Hemicholinium (HC3) and Bungarotoxin (BTX) treatments on the axonal transport of ChAT and its association with the Kinesin-2 motor. (A,B) GFP-ChAT accumulation during 76–79 h AEL in the lch5 axon segments of control, HC3, and BTX -treated preparations. The images are presented as pseudo-colored intensity-heat-map (A), and the fluorescence intensities (B) are presented as per Fig. 1B. (C,D) The relative recovery profiles of GFP-ChAT in the lch5 axon segments upon treatment with Hemicholinium (C) and Bungarotoxin (D) estimated during 76–79 h AEL. (E,F) KLP64D-GFP accumulation in the lch5 axon segments in control, HC3 and BTX-treated preparations during 76–79 h AEL. The images are presented as pseudo-colored intensity-heat-map (E), and the average fluorescence intensity (F) are plotted as Fig. 2B. (G,H) KLP64D-GFP recovery profile in the lch5 axons treated with Hemicholinium (G) and Bungarotoxin (H) estimated during 76–79 h AEL. (I) sFRET distribution depicted in pseudocolor intensity-heat-map between TQ-ChAT and KLP68D-YFP in control, HC3, and BTX treated axon segments during 76–79 h AEL. (H) Normalized sFRET (%) between TQ-ChAT and KLP68D-YFP pair in control, HC3, and BTX treated axons. The values normalized across 76–79 h AEL under each condition. The pair-wise significance of differences assessed using one way ANOVA, and appropriate p-values (ns, * < 0.05, ** < 0.01, *** < 0.001) are indicated on figure panels.
Figure 5
Figure 5
Synaptic activity regulates the anterograde soluble transport of ChAT. Schematic showing possible role of a retrograde signaling feedback that regulates the axonal transport of ChAT. The interaction between ChAT and Kinesin-2 is required for the axonal entry of ChAT and its anterograde propagation. Block in the choline uptake at the presynaptic terminal causes loss in acetylcholine synthesis and release. Lack of postsynaptic stimulation might elicit changes in the presynaptic neuron which further impinge on the interaction between Kinesin-2 and ChAT. As a result ChAT entry into the axon and its active transport by Kinesin-2 are impaired.

References

    1. Wang T, et al. Flux of signalling endosomes undergoing axonal retrograde transport is encoded by presynaptic activity and TrkB. Nat. Commun. 2016;7:12976. doi: 10.1038/ncomms12976. - DOI - PMC - PubMed
    1. Wang T, et al. Control of Autophagosome Axonal Retrograde Flux by Presynaptic Activity Unveiled Using Botulinum Neurotoxin Type A. J. Neurosci. 2015;35:6179–6194. doi: 10.1523/JNEUROSCI.3757-14.2015. - DOI - PMC - PubMed
    1. Cavolo, S. L., Bulgari, D., Deitcher, D. L. & Levitan, E. S. Activity Induces Fmr1-Sensitive Synaptic Capture of Anterograde Circulating Neuropeptide Vesicles. J. Neurosci. 36 (2016). - PMC - PubMed
    1. MacAskill AF, Kittler JT. Control of mitochondrial transport and localization in neurons. Trends Cell Biol. 2010;20:102–112. doi: 10.1016/j.tcb.2009.11.002. - DOI - PubMed
    1. Ma D, Himes BT, Shea TB, Fischer I. Axonal transport of microtubule-associated protein 1B (MAP1B) in the sciatic nerve of adult rat: distinct transport rates of different isoforms. J. Neurosci. 2000;20:2112–20. doi: 10.1523/JNEUROSCI.20-06-02112.2000. - DOI - PMC - PubMed

Publication types

LinkOut - more resources