. 2018 May;557(7707):719-723.
doi: 10.1038/s41586-018-0157-4. Epub 2018 May 23.

Reconstruction of antibody dynamics and infection histories to evaluate dengue risk

Affiliations

Reconstruction of antibody dynamics and infection histories to evaluate dengue risk

Henrik Salje et al. Nature. 2018 May.

Abstract

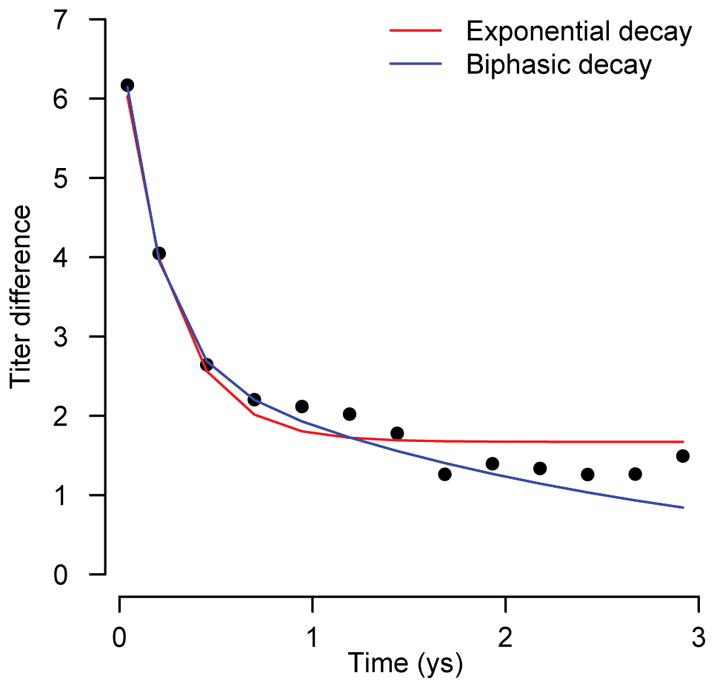
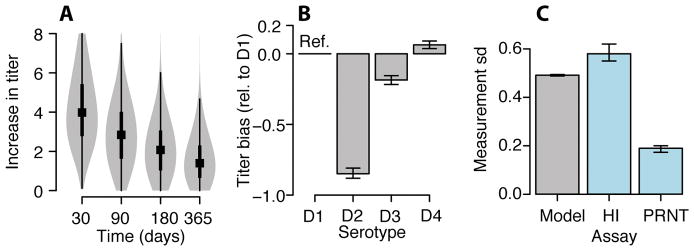
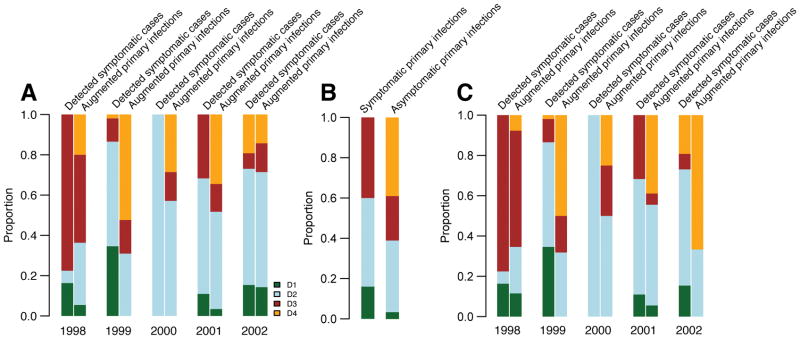
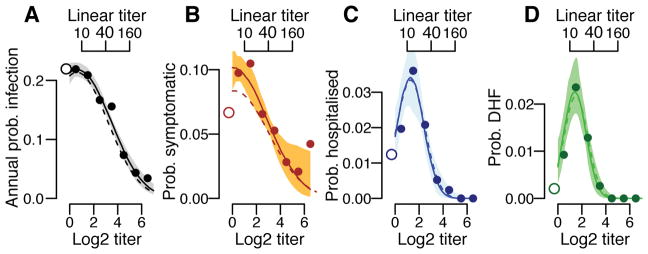
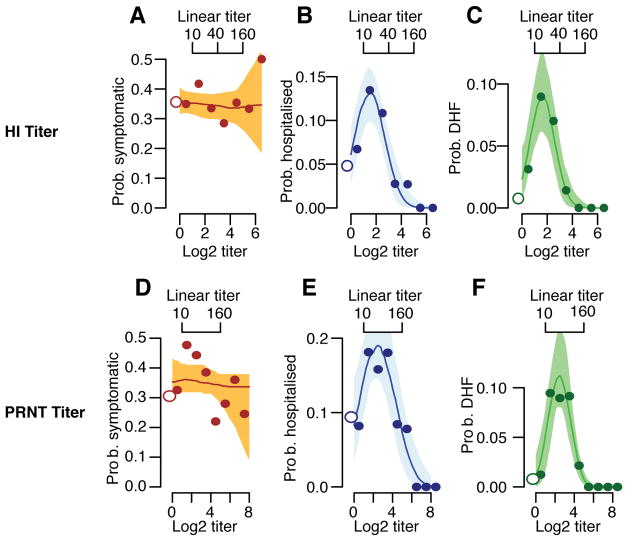
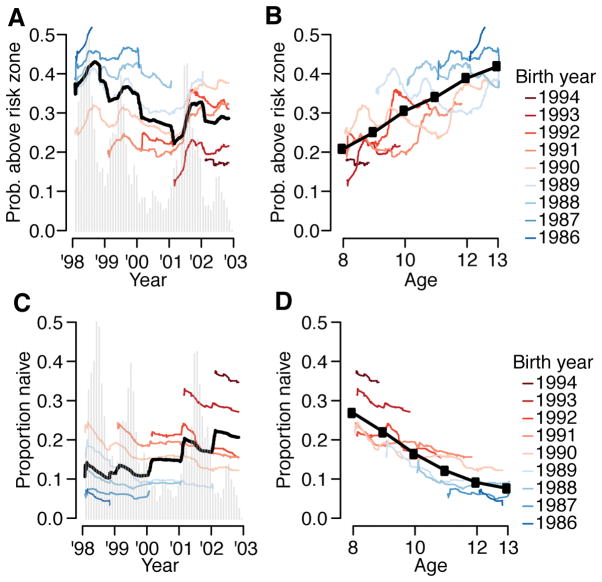
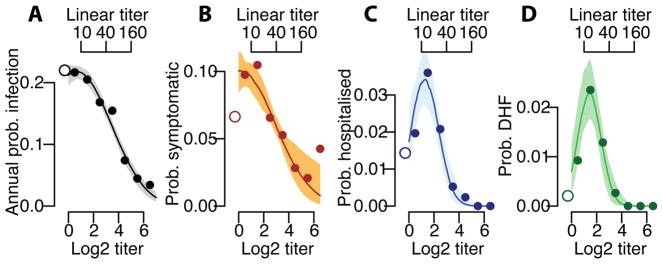
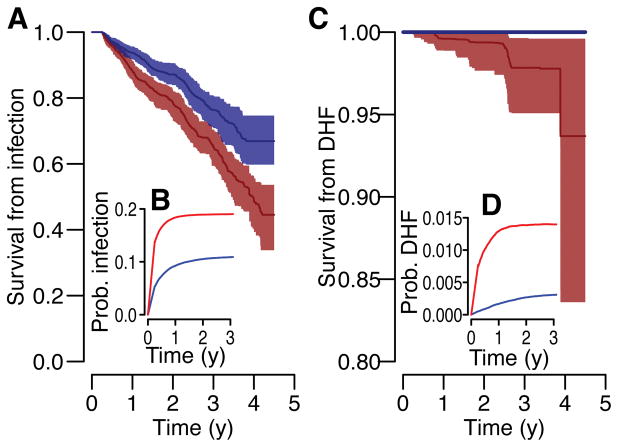
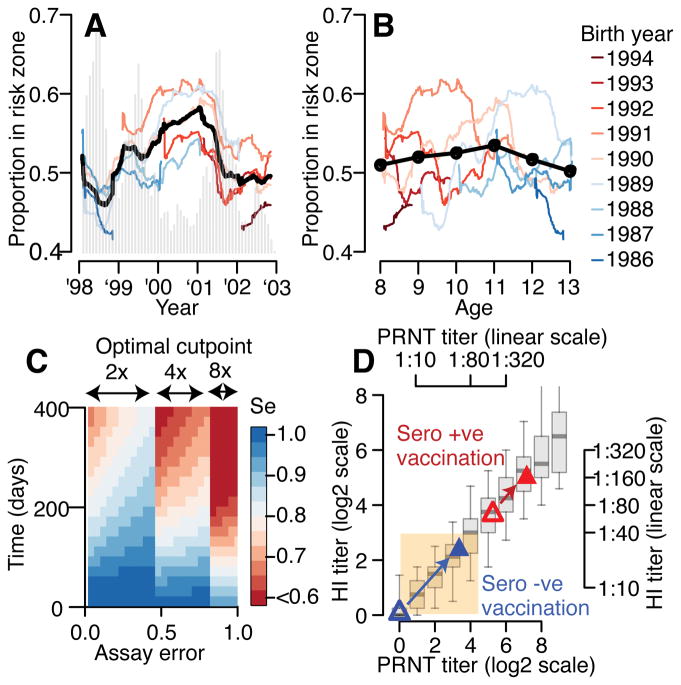
As with many pathogens, most dengue infections are subclinical and therefore unobserved 1 . Coupled with limited understanding of the dynamic behaviour of potential serological markers of infection, this observational problem has wide-ranging implications, including hampering our understanding of individual- and population-level correlates of infection and disease risk and how these change over time, between assay interpretations and with cohort design. Here we develop a framework that simultaneously characterizes antibody dynamics and identifies subclinical infections via Bayesian augmentation from detailed cohort data (3,451 individuals with blood draws every 91 days, 143,548 haemagglutination inhibition assay titre measurements)2,3. We identify 1,149 infections (95% confidence interval, 1,135-1,163) that were not detected by active surveillance and estimate that 65% of infections are subclinical. After infection, individuals develop a stable set point antibody load after one year that places them within or outside a risk window. Individuals with pre-existing titres of ≤1:40 develop haemorrhagic fever 7.4 (95% confidence interval, 2.5-8.2) times more often than naive individuals compared to 0.0 times for individuals with titres >1:40 (95% confidence interval: 0.0-1.3). Plaque reduction neutralization test titres ≤1:100 were similarly associated with severe disease. Across the population, variability in the size of epidemics results in large-scale temporal changes in infection and disease risk that correlate poorly with age.


Conflict of interest statement

The authors declare no competing financial interests or competing interests.

Figures

Extended Data Figure 1
Extended Data Figure 1. Comparison of biphasic versus exponential decay
Biphasic and exponential decay curves fitted to HI antibody measurements following observed symptomatic infections.
Extended Data Figure 2
Extended Data Figure 2. Variability in titer responses and measurement error and bias by serotype
(A) Variability in titer responses. Violin plots showing median (black square), 25% and 75% quantiles (thick black line) and 95% distribution (in grey) of net titer rise at different time points following infection (N=1,420) (B) Estimated underlying differences across serotypes in the measurement of antibody levels by hemagglutination inhibition assay over and above that attributable to infection (DENV1 is reference) with 95% credible intervals (fitted to data from 140,612 titer measurements). (C) Mean estimated error in the hemagglutination inhibition assay estimated with 95% credible intervals using our model results (grey) and empirically derived (blue) from 795 repeated measurements on the same serum compared to that previously empirically derived estimated for plaque reduction neutralization tests (PRNTs) (blue).
Extended Data Figure 3
Extended Data Figure 3. Serotype distributions
(A) Distribution of serotypes by year comparing the detected symptomatic infections by PCR and the augmented primary infections where we could confidently assign the serotype (>50% of model iterations inferring the same serotype). We could confidently assign the serotype in 60% of instances. (B) Serotype distribution for detected symptomatic primary infections and augmented subclinical primary infections where the infecting serotype could be confidently assigned (>50% of model iterations inferring the same serotype). (C) Distribution of serotypes by year comparing the detected symptomatic infections by PCR and the augmented primary infections using a more stringent cutoff that >75% of model iterations infer the same serotype. In this scenario we could confidently assign the serotype in 32% of instances.
Extended Data Figure 4
Extended Data Figure 4. Cox proportional hazards model versus logistic regression
Comparison of results using time varying cox proportional hazards model (dashed line) with that from logistic regression (solid line) for the annualized probability of (A) infection, (B) developing any symptoms, (C) being hospitalized and (D) developing DHF as a function of the mean measured antibody titer across all serotypes at the time of exposure using titer data from all study subjects (N-3,451). The open circles on the left represent primary infections (i.e., those with no detectable titers to any serotype prior to exposure). The shaded regions represent 95% bootstrap confidence intervals. To calculate probabilities, the relative hazards from the cox model are multiplied by the baseline hazard for those with measured titers of 0 (calculated as proportion of person-time with an infection time among those with measured titers of 0).
Extended Data Figure 5
Extended Data Figure 5. Receiver Operating Characteristic to identify DHF infections
Ability of modelled relationship between measured HI titer and risk of DHF to identify those with DHF using those with DHF compared to randomly selected matched controls from individuals in the cohort who had detectable titers at the same time (N=36 with DHF with the same number of matched controls).
Extended Data Figure 6
Extended Data Figure 6. Probability of disease as a function of HI and PRNT titer
Probability of disease as a function of mean titer across the four types at the time of infection. (A) For those infected during the surveillance windows, the probability of developing any symptoms as a function of mean titer (N=781). (B) For those infected during the surveillance windows, the probability of being hospitalized (N=781). (C) For those infected during the surveillance windows, the probability of developing DHF as a function of mean titer (N=781). (D) For those infected during the surveillance windows (N=781), the probability of developing any symptoms as a function of mean PRNT titer. (E) For those infected, the probability of being hospitalized as a function of mean PRNT titer. (F) For those infected, the probability of developing DHF as a function of mean PRNT titer. In each panel, the open circles on the left represent primary infections. The shaded region represents 95% confidence intervals.
Extended Data Figure 7
Extended Data Figure 7. Population-level distribution of titers by birth cohort and age
(A) Proportion of cohort who are naïve as a function of time. (B) Proportion of cohort who are naïve as a function of age. Proportion of cohort with titers above risk zone (i.e., greater than 3) as a function of time (C) and age (D).
Extended Data Figure 8
Extended Data Figure 8. Receiver Operating Characteristic for infection detection under different testing protocols
The ROC for different assay approaches and time between blood draws calculated from 100,000 simulated titer responses. (A) Single serotype assay – if HIs are conducted for just a single serotype at two time points. (B) HIs conducted against all four serotypes. Infections are considered to occur if the ratio of any of the four titers at time point 2 versus time point 1 is greater than the threshold value. (C) HIs conducted against all four serotypes. Infections are considered to occur if the ratio of the mean of the four titers at time point 2 versus the mean at time point 1 is greater than the threshold value.
Extended Data Figure 9
Extended Data Figure 9. Performance of assay dependent on time between blood draws and measurement error
Optimization of assays in detection of events where specificity is maintained at >95%. We explore the performance of three different assay testing protocols: current practice where infection events are defined as a rise above a cut-point in any serotype across two blood draws (A), ‘mean approach’ where the mean across all serotypes is first calculated before comparing across time points (B), ‘mean approach’ where titers are available on a continuous scale (C). For each protocol, we identify the optimal cut-point for a range of assay measurement errors from 100,000 simulated titers based on the fitted titer responses from infections in our study population, that maintains a specificity of >95% (top row). We then calculate the sensitivity of the approach for different time intervals between blood draws using 50% held out data (bottom row). (D)–(F) Same as (A)–(C) but using a more stringent 99% cut-off.
Extended Data Figure 10
Extended Data Figure 10. Clustering of symptomatic (N=274) and subclinical cases (mean N=507 across 100 reconstructed datasets) by school by time and serotype
(A) Probability of observing an augmented subclinical infection (irrespective of serotype) occurs at different time intervals within the same school of a detected symptomatic case relative to the probability of observing an augmented subclinical infection occurring in a different school in that same time interval. (B) For augmented primary infections that are consistently of the same serotype (defined as >50% of augmented datasets have a primary infection in the same individual caused by the same serotype in the same six-month time window). Probability that an augmented primary infection that occurs within a fixed time window of a PCR-confirmed case and in the same is of the same serotype relative to the probability that an augmented primary infection that occurs within the same time window in a different school is of the same serotype. Note that the modelling framework can only allow differentiation of serotypes for primary infections. Cross-reaction prevents differentiation in post-primary infections. Overall, 60% of primary infections have a consistent serotype for a primary infection across augmented datasets. Each boxplot presents the 2.5%, 25%, 75% and the 97.5% quantiles of the distribution as well as the mean.
Figure 1
Figure 1. Titer responses following infection
(A) Measured (dots) and model fit (lines) for three example individuals. Each dot represents the mean titer across the four serotypes. The pink shaded regions are periods of active surveillance. The solid blue arrows represent confirmed symptomatic dengue infections. The open blue arrows represent estimates of timing of subclinical infections from an augmented dataset. During the active surveillance windows, these augmented infections represent subclinical infections whereas outside the surveillance window, it is unknown if the individual had symptoms. (B) Serotype distribution of PCR confirmed symptomatic infections (DENV1 – green, DENV2 - blue, DENV3 - maroon, DENV4 – orange, unknown serotype – black). The grey bars represent the estimated distribution of infections not detected from active surveillance. The periods of active surveillance are in pink (5.5 months per year). (C) Model fit (lines) and observed (dots) titers pre and post infection for primary infections (infecting serotype in blue, non-infecting serotypes in red) and post-primary infections (green). (D) Mean difference between observed log2-titer at different time points following infection with that at 1 year for all augmented and observed infections (average of 1,421 total infections across 100 reconstructed datasets) with 95% confidence intervals. (E) Titer ratio of the infecting to the mean of the three non-infecting serotypes before and after symptom onset with 95% confidence intervals for the 217 individuals with symptomatic infections where infecting serotype detected (N=3,366 total titer measurements).
Figure 2
Figure 2. Probability of infection and disease as a function of titer
Annualized probability of (A) infection, (B) developing any symptoms, (C) being hospitalized and (D) developing DHF as a function of the mean measured antibody titer across all serotypes at the time of exposure across all study subjects (N=3,451). The open circles on the left represent primary infections (i.e., those with no detectable titers to any serotype prior to exposure). The shaded regions represent 95% bootstrap confidence intervals.
Figure 3
Figure 3. Risk of subsequent infection and disease following an infection event (from average of 1,420 infections across 100 reconstructed datasets)
The probability of survival from subsequent infection (irrespective of disease outcome (A) and that lead to DHF (C)) as calculated from Kaplan-Meier for those with setpoint antibody titers of ≤3 (red) and >3 (blue) with 95% confidence intervals. The annualized probability of a subsequent infection (irrespective of disease outcome (B) and that lead to DHF (D)) at different time points following infection for those with setpoint antibody titers of ≤3 (red) and >3 (blue).
Figure 4
Figure 4. Evolution of population risk, implications for vaccine and cohort design
(A) Proportion of study participants who have titers in risk zone (defined detectable log2-titers ≤3) over the study period for different birth-cohorts (colored lines) and overall (black). The epidemic curve of all infections is in grey. (B) Proportion of study participants with titers in risk-zone as a function of age for different birth-cohorts (colored lines) and overall (black). (C) Performance of current assay testing protocol where infection events are defined as a rise above a cut-point in any serotype across two blood draws. (D) Relationship between PRNT titer and HI titer where both assays were performed (N=1,771 samples). The boxplots show 2.5, 25, 75 and 97.5 quantiles as well as the mean. Superimposed are the results from the Denvaxia vaccine for previously seronaive (blue) and seropositive (red) prior (open symbols) and post (filled symbols) vaccination.

Comment in

  • Detecting dengue.
    Stower H. Stower H. Nat Med. 2018 Jul;24(7):898. doi: 10.1038/s41591-018-0120-9. Nat Med. 2018. PMID: 29988137 No abstract available.

References

    1. Undurraga EA, Halasa YA, Shepard DS. Use of expansion factors to estimate the burden of dengue in Southeast Asia: a systematic analysis. PLoS Negl Trop Dis. 2013;7:e2056. - PMC - PubMed
    1. Endy TP, et al. Epidemiology of inapparent and symptomatic acute dengue virus infection: a prospective study of primary school children in Kamphaeng Phet, Thailand. American Journal of Epidemiology. 2002;156:40–51. - PubMed
    1. Cauchemez S, Ferguson NM. Methods to infer transmission risk factors in complex outbreak data. J R Soc Interface. 2012;9:456–469. - PMC - PubMed
    1. Bhatt S, et al. The global distribution and burden of dengue. Nature. 2013;496:504–507. - PMC - PubMed
    1. Halstead SB. Dengue. Imperial College Press; London: 2008.

Publication types