. 2018 May 25;7(5):42.
doi: 10.1038/s41389-018-0051-9.

NOTCH3 inactivation increases triple negative breast cancer sensitivity to gefitinib by promoting EGFR tyrosine dephosphorylation and its intracellular arrest

Affiliations

NOTCH3 inactivation increases triple negative breast cancer sensitivity to gefitinib by promoting EGFR tyrosine dephosphorylation and its intracellular arrest

Giulia Diluvio et al. Oncogenesis. .

Abstract

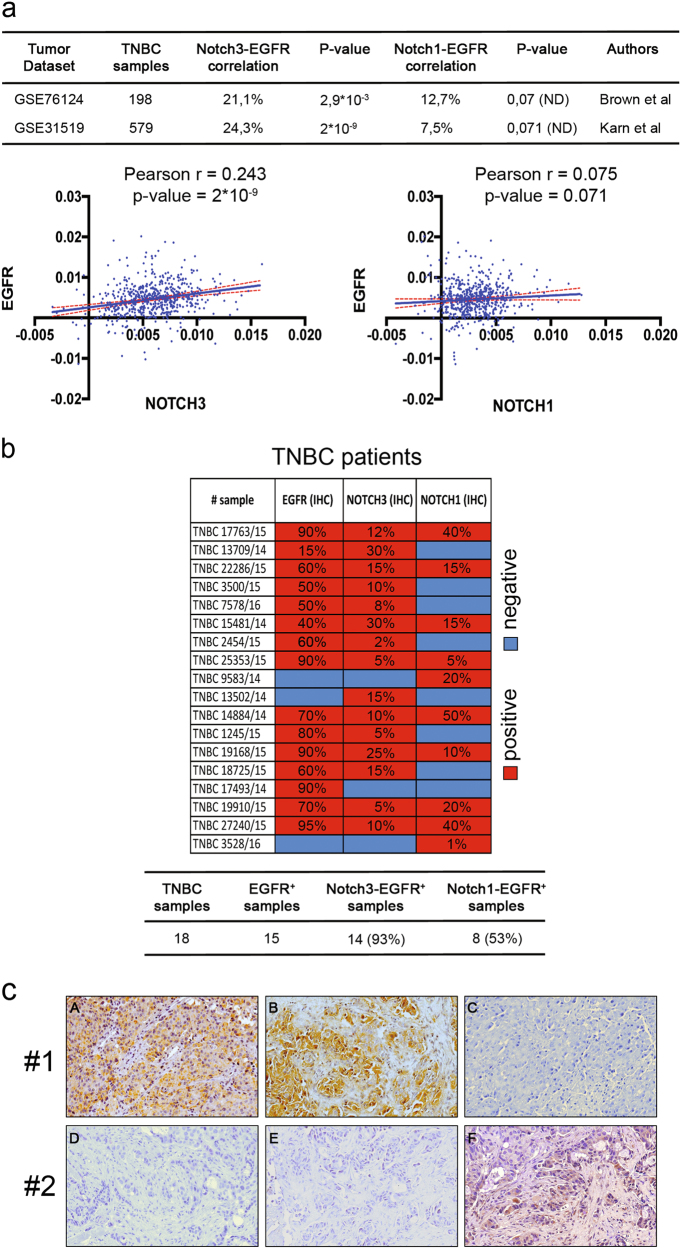
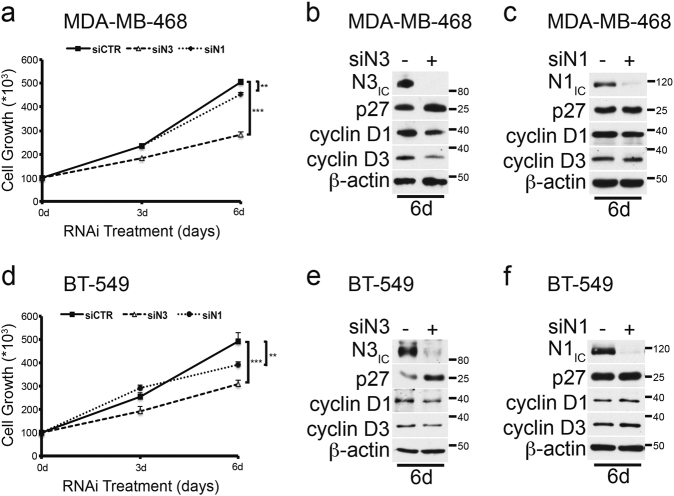
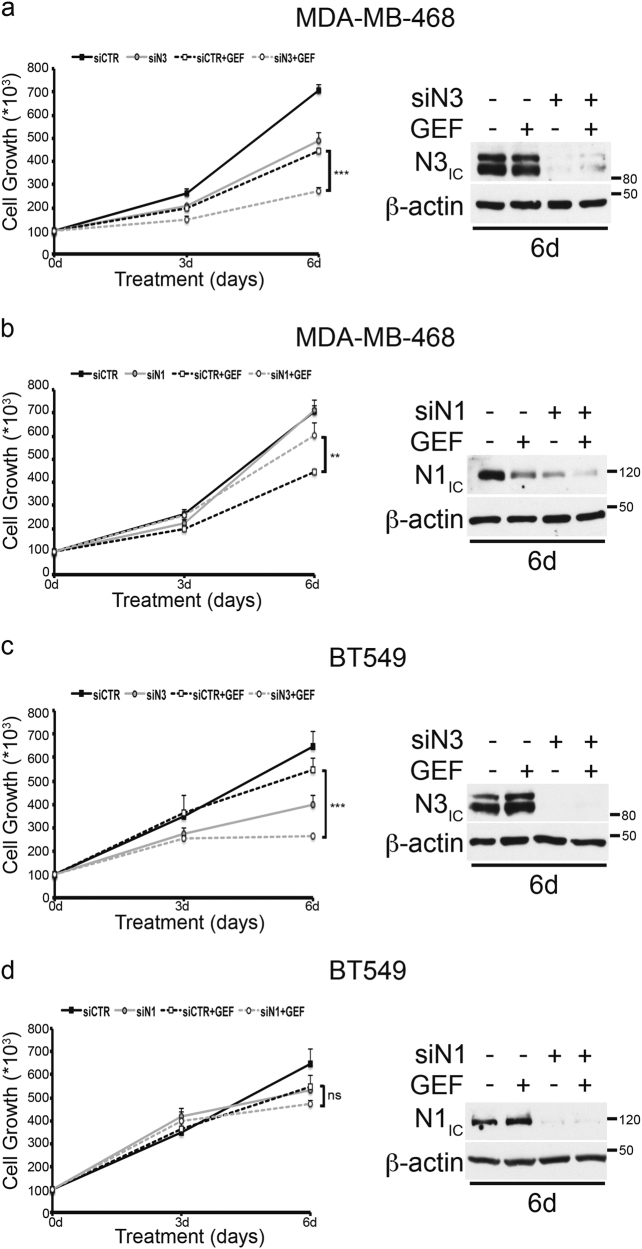
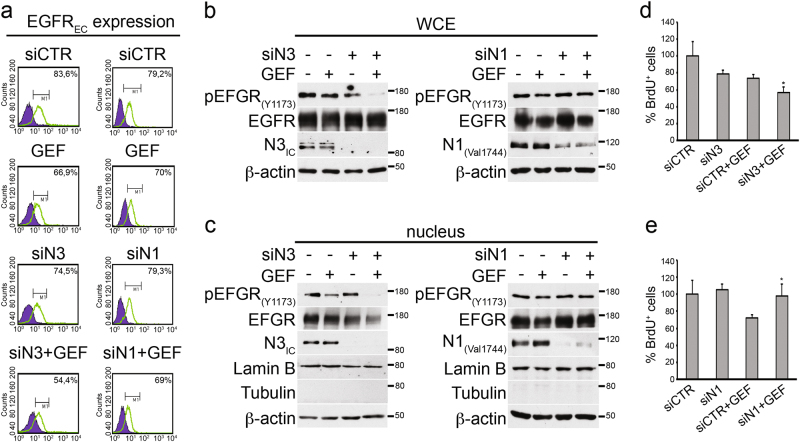
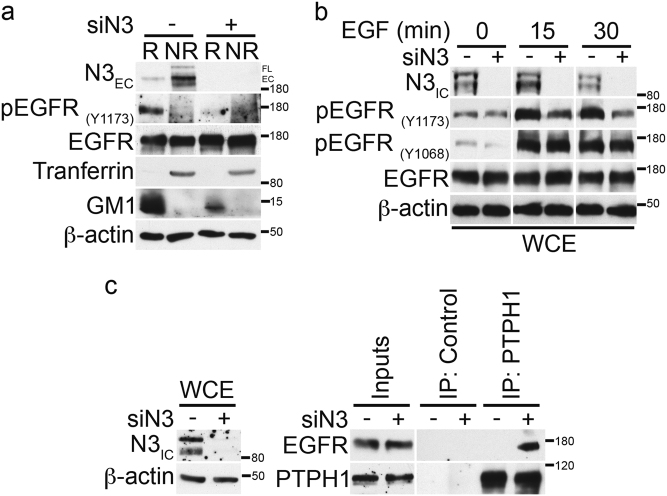
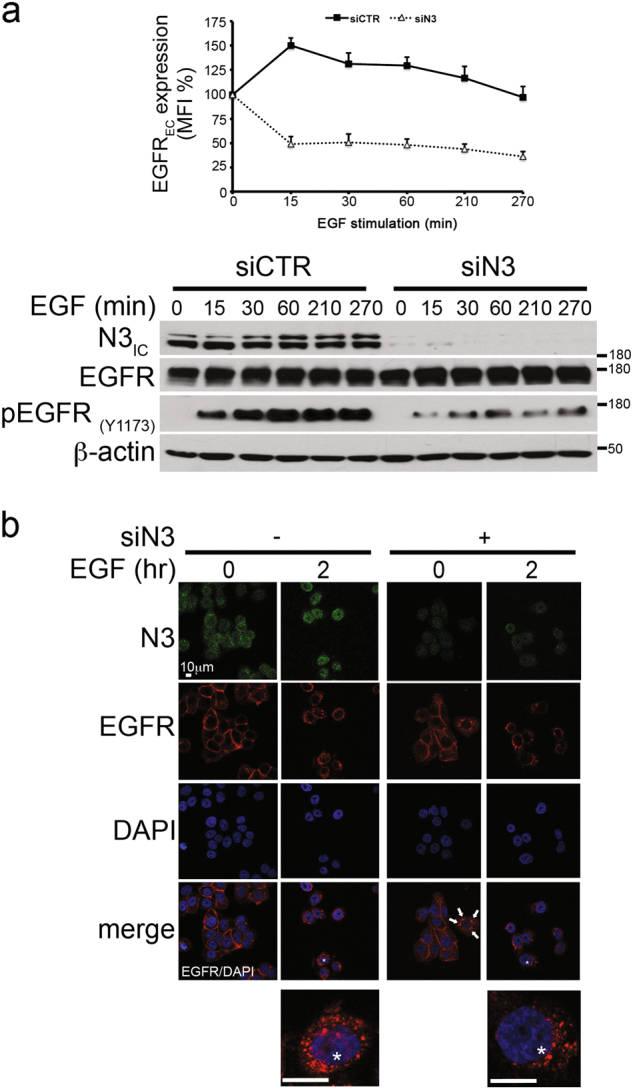
Notch dysregulation has been implicated in numerous tumors, including triple-negative breast cancer (TNBC), which is the breast cancer subtype with the worst clinical outcome. However, the importance of individual receptors in TNBC and their specific mechanism of action remain to be elucidated, even if recent findings suggested a specific role of activated-Notch3 in a subset of TNBCs. Epidermal growth factor receptor (EGFR) is overexpressed in TNBCs but the use of anti-EGFR agents (including tyrosine kinase inhibitors, TKIs) has not been approved for the treatment of these patients, as clinical trials have shown disappointing results. Resistance to EGFR blockers is commonly reported. Here we show that Notch3-specific inhibition increases TNBC sensitivity to the TKI-gefitinib in TNBC-resistant cells. Mechanistically, we demonstrate that Notch3 is able to regulate the activated EGFR membrane localization into lipid rafts microdomains, as Notch3 inhibition, such as rafts depletion, induces the EGFR internalization and its intracellular arrest, without involving receptor degradation. Interestingly, these events are associated with the EGFR tyrosine dephosphorylation at Y1173 residue (but not at Y1068) by the protein tyrosine phosphatase H1 (PTPH1), thus suggesting its possible involvement in the observed Notch3-dependent TNBC sensitivity response to gefitinib. Consistent with this notion, a nuclear localization defect of phospho-EGFR is observed after combined blockade of EGFR and Notch3, which results in a decreased TNBC cell survival. Notably, we observed a significant correlation between EGFR and NOTCH3 expression levels by in silico gene expression and immunohistochemical analysis of human TNBC primary samples. Our findings strongly suggest that combined therapies of TKI-gefitinib with Notch3-specific suppression may be exploited as a drug combination advantage in TNBC treatment.


Conflict of interest statement

The authors declare that they have no conflict of interest.

Figures

Fig. 1
Fig. 1. Notch3 and EGFR levels correlate in TNBC primary samples.
a Upper panel: summary of the NOTCH3-EGFR and NOTCH1-EGFR gene expression levels correlation obtained by an in silico analysis from two TNBC tissue arrays (GSE76124 and GSE31519). Lower panels: representative graphs showing correlation between NOTCH3 (left) or NOTCH1 (right) and EGFR gene expression levels from GSE31519 dataset in a cohort of 579 TNBC patients. In both graphs, each dot corresponds to one patient and the expression value of NOTCH3, NOTCH1, and EGFR is given in log2 scale after normalizing data with justRMA algorithm normalization. The XY axis represent NOTCH3 (left) or NOTCH1 (right) and EGFR (both) expression levels, respectively. The index Pearson’s R indicated expresses the linear relation between paired samples and P-values were calculated using Student’s T-test, as described in Material and Methods section. b Upper panel: heatmap representing the protein levels of EGFR, Notch3, and Notch1 obtained by immunohistochemical analysis (IHC) in a cohort of 18 TNBC patients. The colors represent positive (red) or negative (blue) protein levels according to protein expression cutoff (see Materials and Methods section). Lower panel: summary of the Notch3-EGFR and Notch1-EGFR protein expression levels correlation showing percentage of each category calculated on the precedent category of patients. c Pattern of immunostaining in two different cases of TNBC. In case 1 (upper panels), there is a strong and diffuse staining of neoplastic cells both for EGFR (A) and Notch3 (B), whereas Notch1 is completely negative (C). In case 2 (lower panels), the neoplastic cells are negative for both EGFR (D) and Notch3 (E), whereas Notch1 (F) shows a weak positivity in about 20% of the cells
Fig. 2
Fig. 2. Notch3 downregulation by siRNA affects TNBC cells survival.
a, d Analysis of cell growth after 0–3–6 days of Notch3 and Notch1 silencing in a MDA-MB-468 and d BT-549 cells. b, c Whole cell extracts from a MDA-MB-468 or d BT-549 cells at 6 day of silencing were used for western blot against Notch3 (N3IC) and Notch1 (N1IC), to control the efficiency of the b, e Notch3 and c, f Notch1 silencing, respectively. Extracts were then immunoblotted with anti-p27, anti-cyclin D1, and anti-cyclin D3 antibodies. Anti-β-actin was used as a loading control. b, c, e, f are representative of three separate experiments. The statistical analysis associated is available in the Supplementary Figure S2
Fig. 3
Fig. 3. Notch3 downregulation (but not Notch1) sensitizes TNBC cells to TKI-gefitinib.
ad Left panels: inhibition of a, b MDA-MB-468 and c, d BT-549 cell growth was observed after gefitinib (GEF) treatment combined with Notch3 silencing in a, c but not with b, d Notch1 silencing. All the right panels showed in the figure represent western blotting of total extracts from cells described above against Notch3 (N3IC) and Notch1 (N1IC), to control the efficiency of the a, c Notch3 and b, d Notch1 silencing, respectively. Anti-β-actin was used as a loading control. All data are representative of at least three independent experiments, each in triplicate. Results shown in a, b, c, and d are expressed as the means average deviations and P-values were calculated using Student’s T-test (i.e., ns not significant; P > 0.05, *P ≤ 0.05, **P ≤ 0.01, ***P ≤ 0.001)
Fig. 4
Fig. 4. Combined Notch3 and EGFR targeting induces EGFR internalization but defect the nuclear-activated EGFR localization.
a FACS analysis of the EGFR surface expression (EGFREC) in MDA-MB-468 cells treated with gefitinib (GEF) alone or in combination with Notch3-silencing (siN3 + GEF) or Notch1 silencing (siN1 + GEF) for 6 days. b Whole cell extracts (WCE) and c nuclear extracts from the same cells used in a were immunoblotted with anti-EGFR and anti-pEGFR(Y1173) antibodies, to evaluate the EGFR expression and phosphorylation, and with anti-N3IC or anti-N1Val1744 antibody to control the efficiency of Notch3 (left panels) or Notch1 (right panels) silencing, respectively. Anti-lamin B and anti-tubulin were used as fraction markers; anti-β-actin was used as a loading control. d, e Proliferation analysis by BrdU assay (see Matherials and Methods section): compared with control cells (siCTR + GEF), the percentage of BrdU+ cells is lower after Notch3 silencing plus d GEF (siN3 + GEF) and not after Notch1 silencing plus e GEF (siN1 + GEF). All data are representative of at least three independent experiments, each in triplicate. Results are expressed as the means average deviations and P-values were calculated using Student’s T-test (i.e., *P ≤ 0.05)
Fig. 5
Fig. 5. Rafts depletion induces endogenous EGFR-PTPH1 interaction, EGFR dephopshorylation, and its intracellular arrest in MDA-MB-468 TNBC cells.
a Immunofluorescence assay (IF) was performed by using anti-EGFR (green) and anti-GM1 (red) antibodies to reveal the endogenous EGFR-rafts colocalization, shown in yellow (merge). Nuclei were DAPI labeled (blue). b Raft (R) and non-raft (NR) fractions derived from Methyl-β-cyclodextrin (MβCD)-treated and untreated cells were used for immunoblot assay with anti-pEGFR(Y1173) (indicated as pEGFR) and anti-EGFR antibodies, to test activated and total EGFR expression in rafts compartment, respectively. Anti-transferrin and anti-GM1 antibodies were used as a fraction markers. c Cells have been activated with EGF ligand for the times indicated, in the presence or absence of MβCD: the expression of phospho-EGFR at tyrosine 1173 and 1068 residues and total EGFR was determined in whole cell extracts by immunoblot analysis using the specific indicated antibodies. df MDA-MB-468 cells were treated with MβCD and stimulated with EGF for 60 min: control or anti-PTPH1 antibody immunoprecipitates were probed with anti-EGFR, to detect the EGFR-PTPH1 binding, and with the anti-PTPH1 antibody, to show PTPH1 immunoprecipitated protein levels. The inputs indicated in the panel shows 5% of each total lysate d. Relative EGFR extracellular expression (EGFREC) was evaluated by FACS e. IF assay was performed by using anti-EGFR (red) antibody to reveal the endogenous EGFR intracellular localization. Nuclei were DAPI labeled (blue). White arrows indicated peri-nuclear EGFR localization in EGF stimulated MβCD-treated cells (f). a, f Representative single plane confocal IF images captured using a × 60 oil objective. Scale bar: 10 μm. In both b and c, western blotting against the anti-β-actin was used as a loading control. All data are representative of at least three independent experiments, each in triplicate. Results shown in e are expressed as the means average deviations and P-values were calculated using Student’s T-test (i.e., ns, not significant P > 0.05, **P ≤ 0.01)
Fig. 6
Fig. 6. Notch3 downregulation induces EGFR dephosphorylation by promoting the endogenous EGFR/PTPH1 interaction.
a Raft (R) and non-raft (NR) fractions derived from 6 days of Notch3-silenced cells were used for immunoblot assay with anti-N3EC, anti-pEGFR(Y1173), and anti-EGFR antibodies, to test the effect of Notch3 downmodulation on EGFR-rafts localization. Anti-transferrin and anti-GM1 were used as a fraction markers. b Cells have been activated with EGF ligand for the times indicated, combined or not with Notch3 silencing for 3 days: the expression of phospho-EGFR at tyrosine 1173 and 1068 residues and total EGFR was determined by immunoblot analysis using the specific indicated antibodies. c Control or anti-PTPH1 antibody immunoprecipitates from control and Notch3-silenced cells were probes with anti-EGFR, to detect the EGFR-PTPH1 binding, and with the anti-PTPH1 antibody, to show PTPH1 immunoprecipitated protein levels. The inputs indicated in the panel shows 5% of each total lysate (right panels). Whole cell extracts (WCE) were incubated with anti-N3IC antibody to control the efficiency of Notch3 silencing (left panels). In all panels a, b and c, western blotting against the anti-β-actin was used as a loading control. The results are representative of three independent experiments
Fig. 7
Fig. 7. Notch3 downregulation induces EGFR internalization and intracellular arrest.
a Upper panel: FACS analysis of the EGFR surface expression (EGFREC) in control (siCTR) and Notch3-silenced (siN3) cells after EGF stimulation for the time indicated, shown as percentage of the mean fluorescence intensity (MFI) respect to the EGF-untreated cells (t = 0). lower panel: Western blot analysis of the total extracts from the same cells probed with anti-Notch3 (N3IC) antibody, to test the efficiency of Notch3 silencing, and with anti-EGFR and anti-pEGFR(Y1173) antibodies, to evaluate the EGFR expression. The β-actin expression was used as loading control. b MDA-MB-468 cells were Notch3-silenced for 48 h and EGF-treated for 2 h: Immunofluorescence assay (IF) was performed by using anti-Notch3 green) or anti-EGFR (red) antibodies to test the efficacy of Notch3 silencing and to reveal the endogenous EGFR intracellular localization, respectively. Nuclei were DAPI labeled (blue). EGFR/DAPI merge is shown. White arrows indicate peri-nuclear EGFR localization in Notch3-silenced cells. The * indicate the higher magnification of a single EGF-stimulated control cell (left) and Notch3-silenced (right) cell. All the panels are representative single plane confocal IF images captured using a × 60 oil objective. Scale bar: 10 μm. The results are representative of three independent experiments

Similar articles

Cited by

References

    1. Dawson SJ, Provenzano E, Caldas C. Triple negative breast cancers: clinical and prognostic implications. Eur. J. Cancer. 2009;45(Suppl 1):27–40. doi: 10.1016/S0959-8049(09)70013-9. - DOI - PubMed
    1. Hoadley KA, et al. EGFR associated expression profiles vary with breast tumor subtype. BMC Genomics. 2007;8:258. doi: 10.1186/1471-2164-8-258. - DOI - PMC - PubMed
    1. Nakai K, Hung MC, Yamaguchi H. A perspective on anti-EGFR therapies targeting triple-negative breast cancer. Am. J. Cancer Res. 2016;6:1609–1623. - PMC - PubMed
    1. Masuda H, et al. Role of epidermal growth factor receptor in breast cancer. Breast Cancer Res. Treat. 2012;136:331–345. doi: 10.1007/s10549-012-2289-9. - DOI - PMC - PubMed
    1. Bianco R, et al. Loss of PTEN/MMAC1/TEP in EGF receptor-expressing tumor cells counteracts the antitumor action of EGFR tyrosine kinase inhibitors. Oncogene. 2003;22:2812–2822. doi: 10.1038/sj.onc.1206388. - DOI - PubMed