. 2018 Aug;32(8):1751-1761.
doi: 10.1038/s41375-018-0150-9. Epub 2018 May 24.

Consequences of mutant TET2 on clonality and subclonal hierarchy

Affiliations

Consequences of mutant TET2 on clonality and subclonal hierarchy

Cassandra M Hirsch et al. Leukemia. 2018 Aug.

Abstract

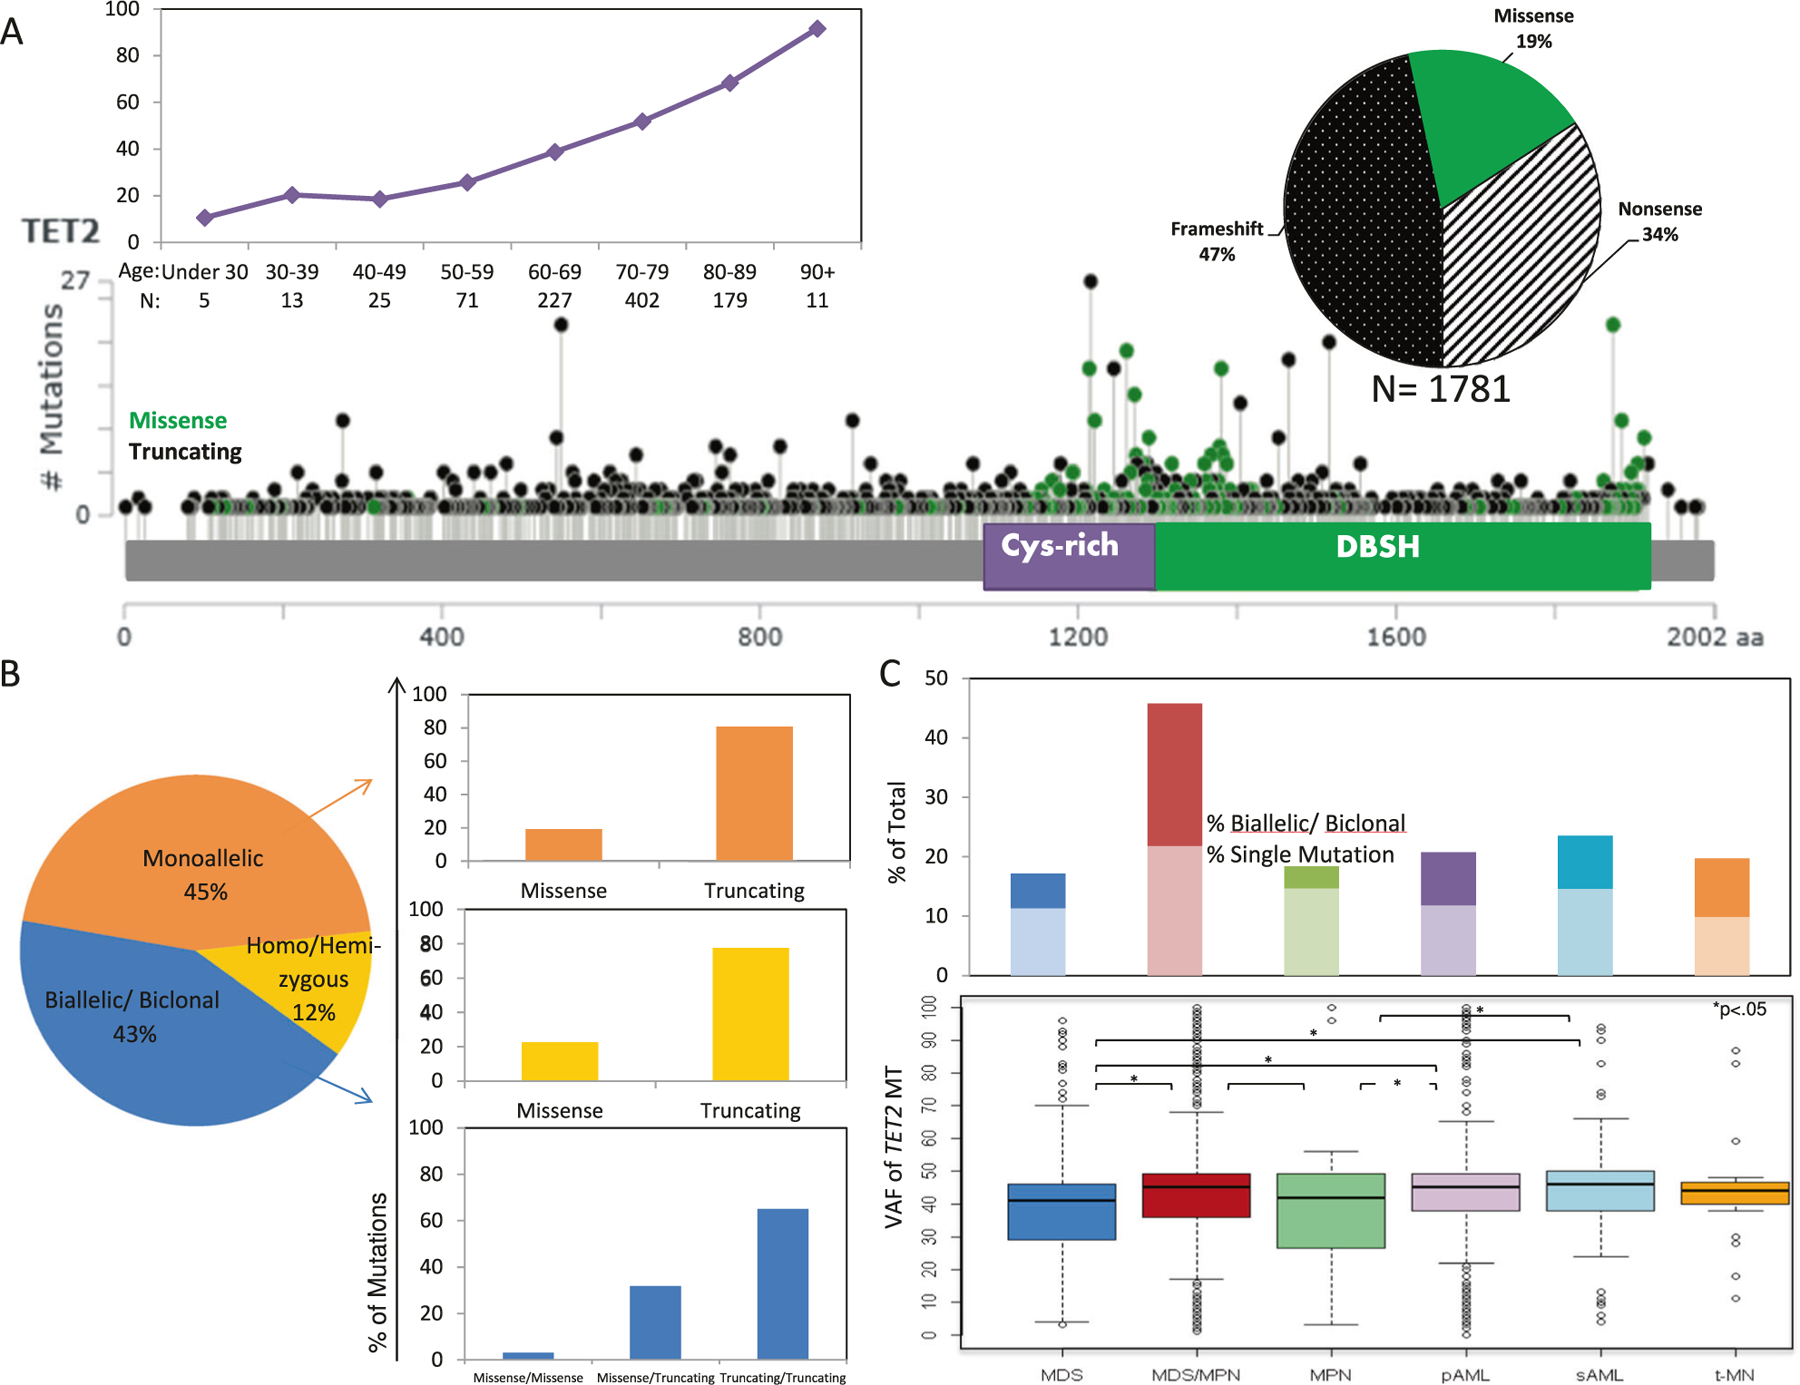
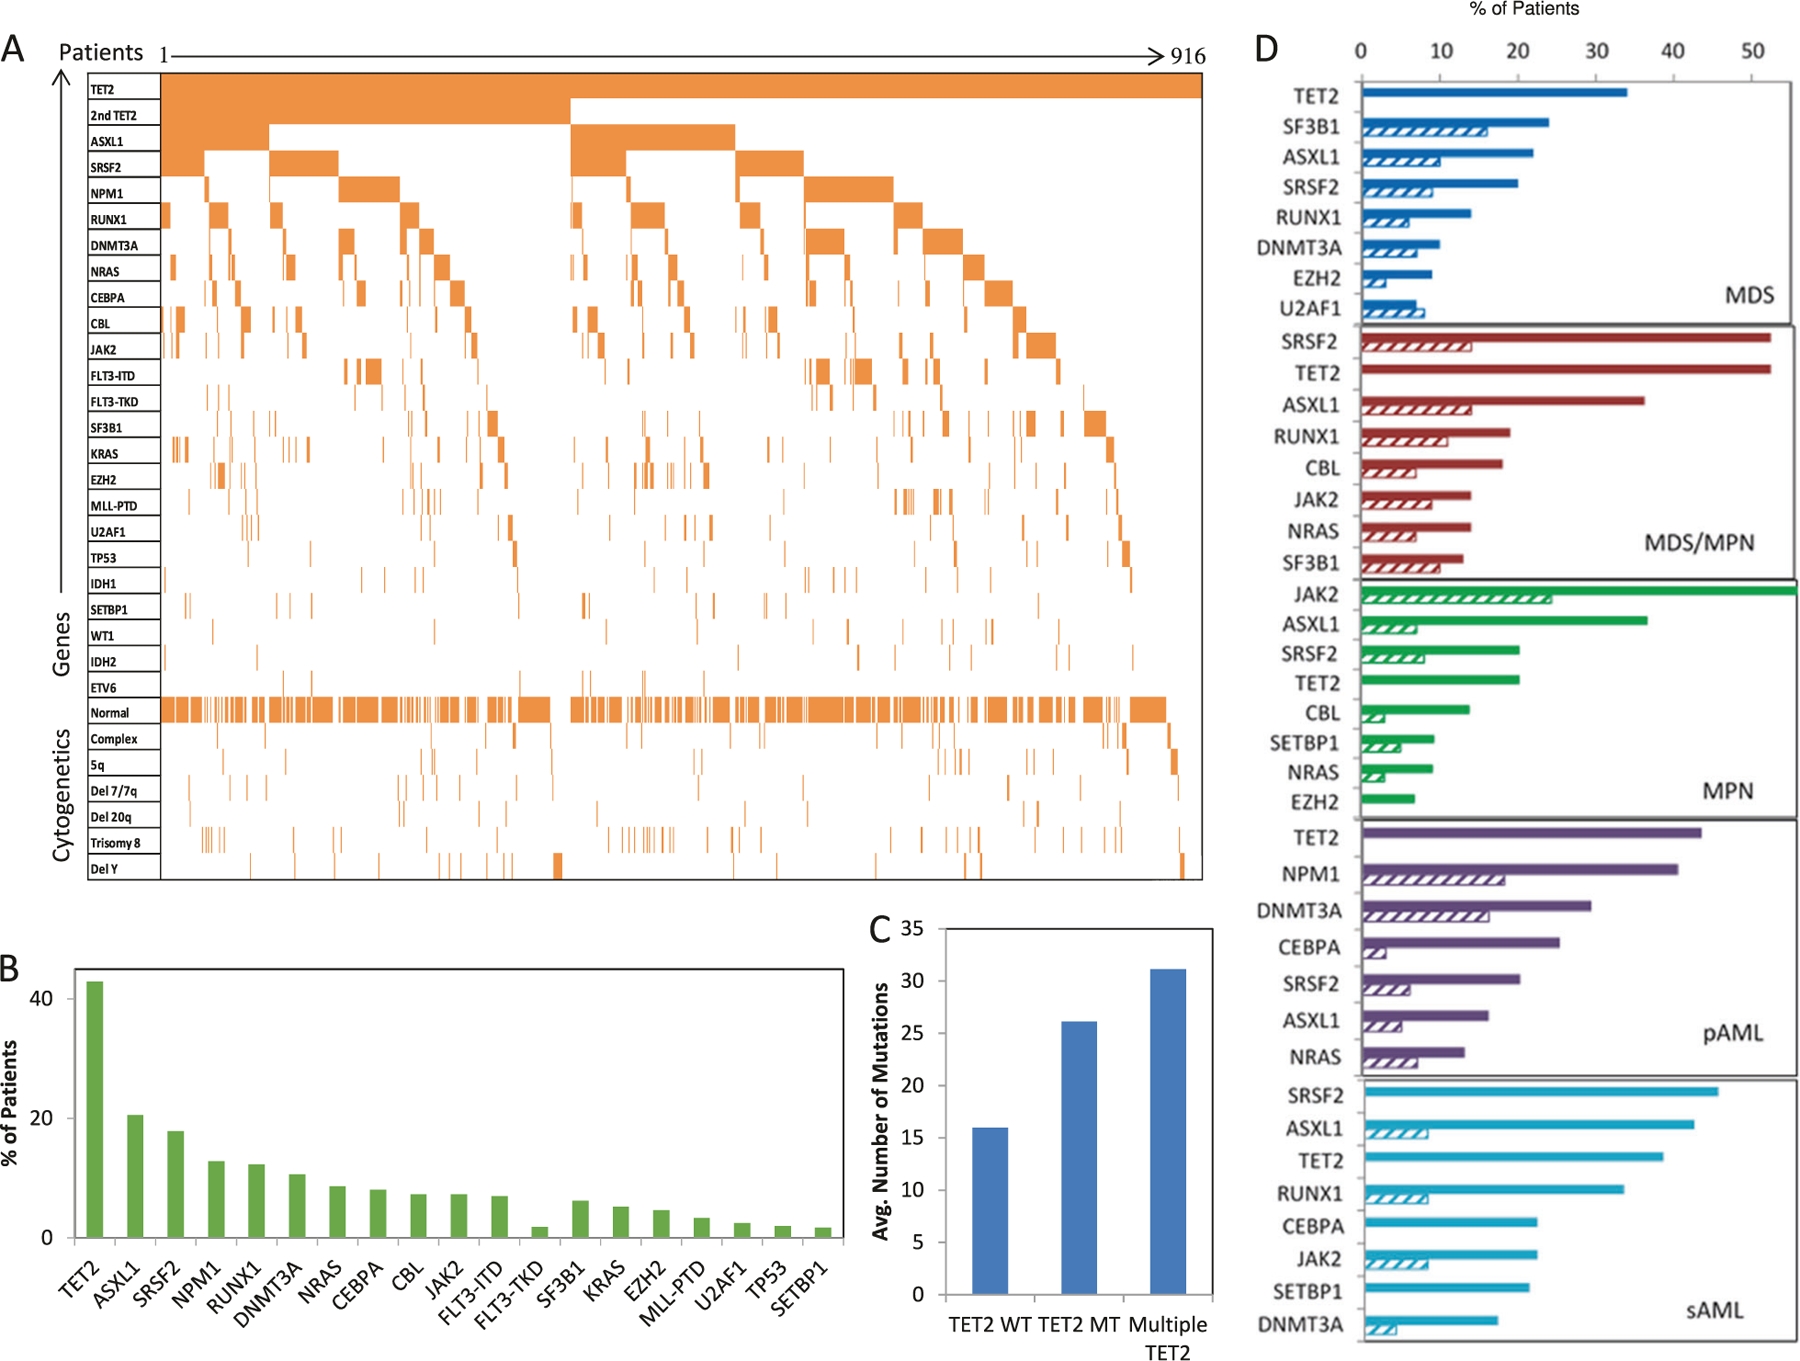
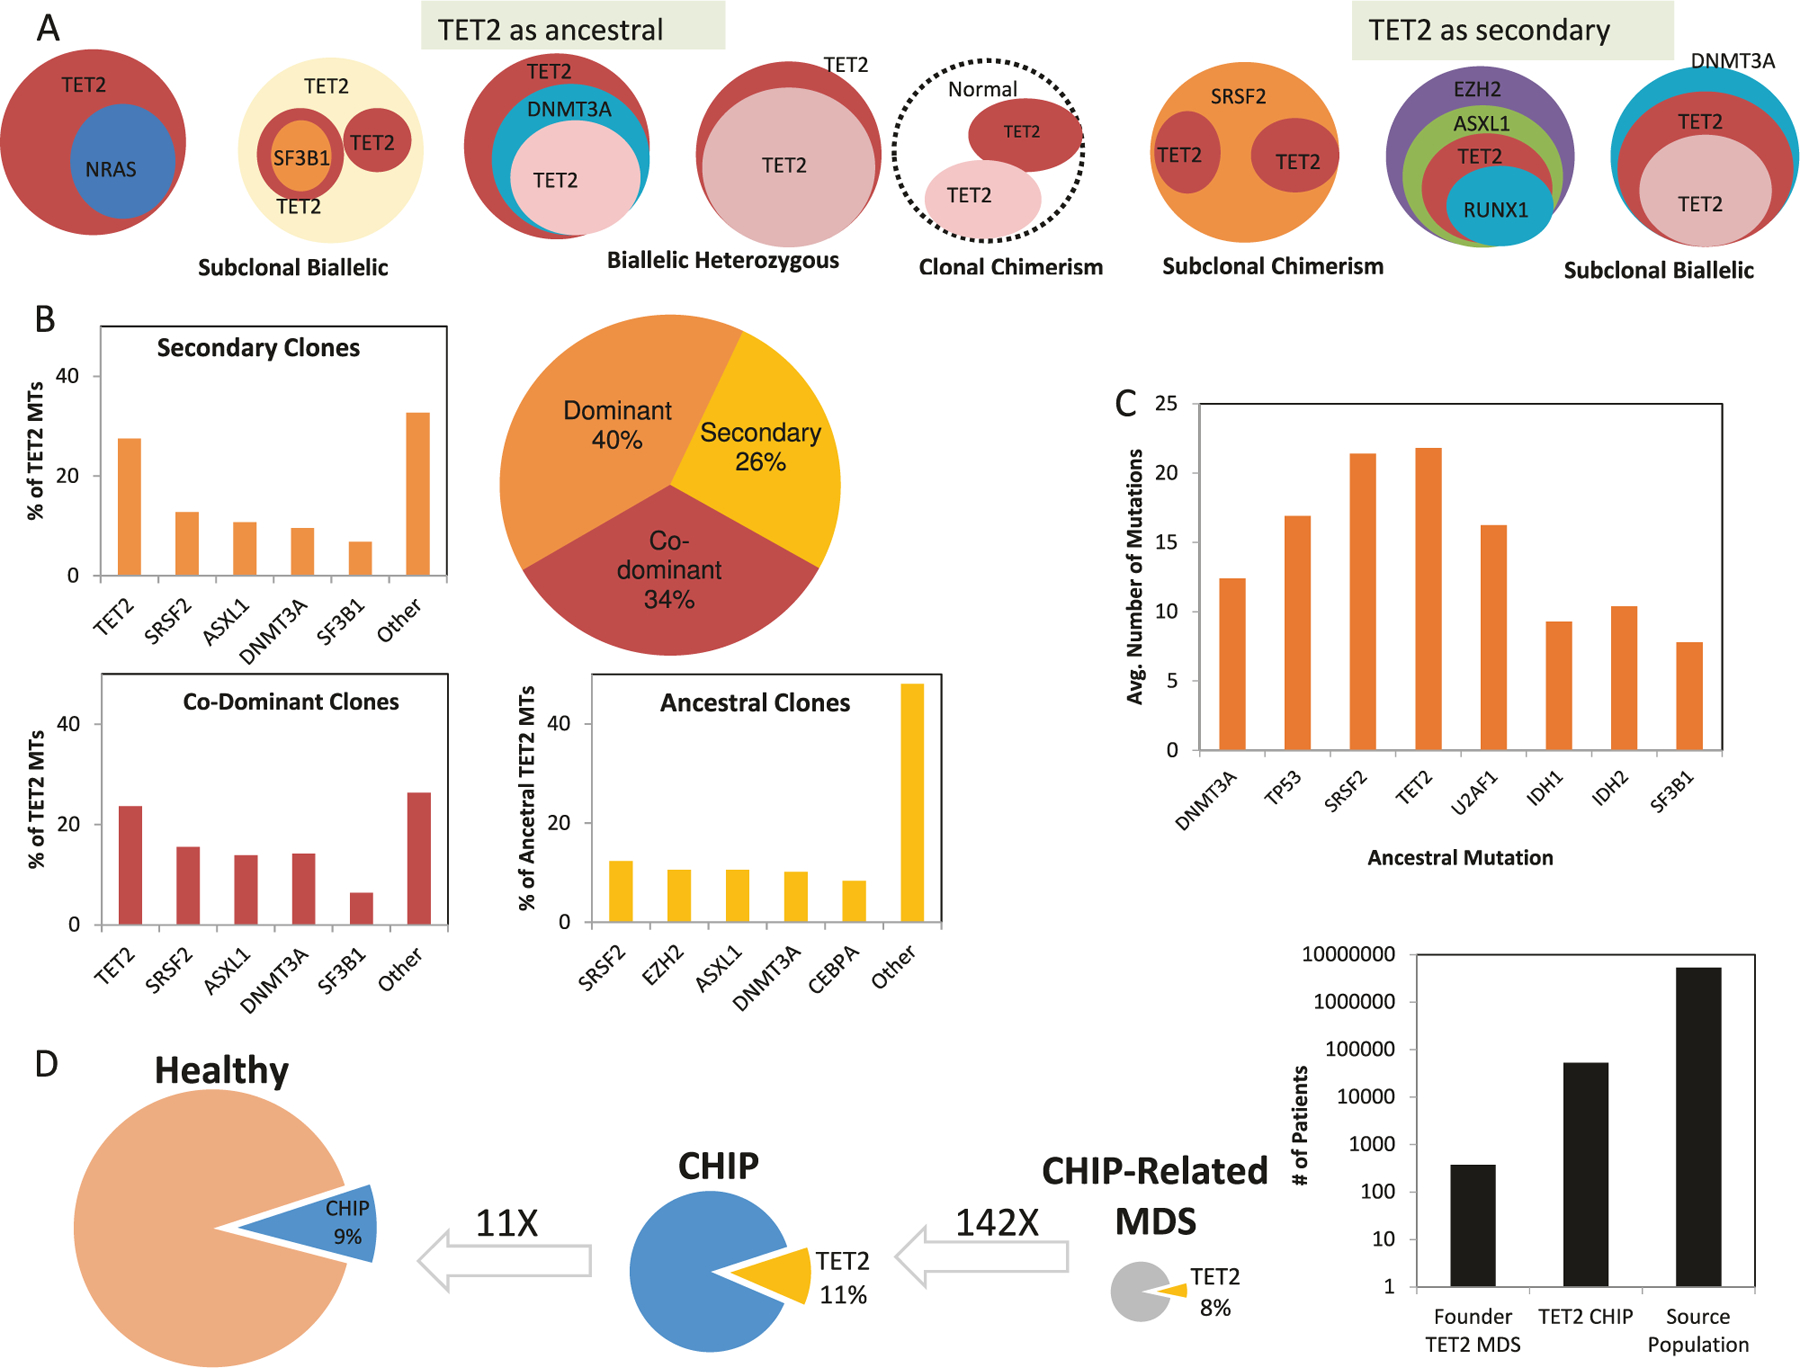
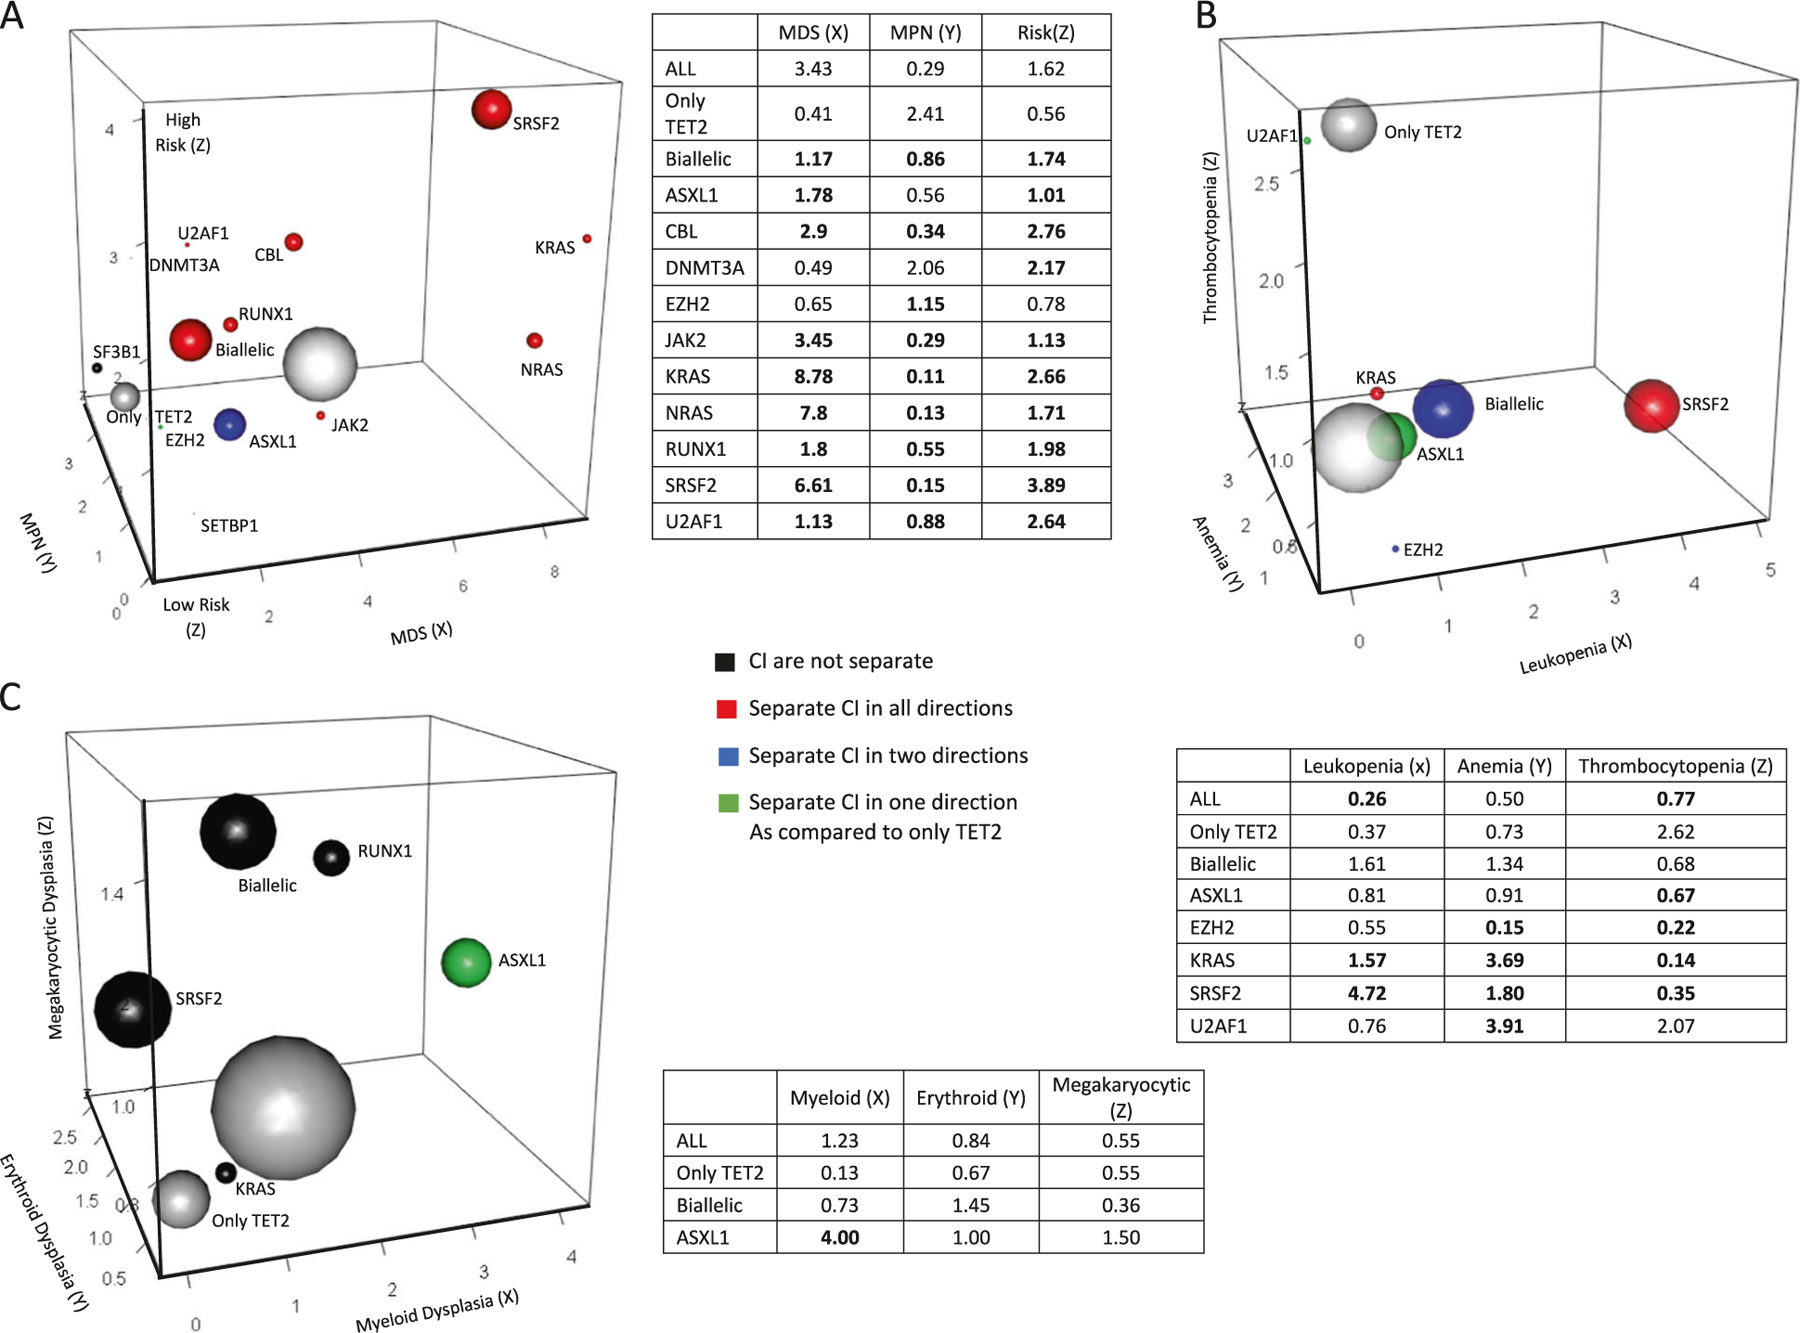
Somatic mutations in TET2 are common in myelodysplastic syndromes (MDS), myeloproliferative, and overlap syndromes. TET2 mutant (TET2MT) clones are also found in asymptomatic elderly individuals, a condition referred to as clonal hematopoiesis of indeterminate potential (CHIP). In various entities of TET2MT neoplasia, we examined the phenotype in relation to the strata of TET2 hits within the clonal hierarchy. Using deep sequencing, 1781 mutations were found in 1205 of 4930 patients; 40% of mutant cases were biallelic. Hierarchical analysis revealed that of TET2MT cases >40% were ancestral, e.g., representing 8% of MDS. Higher (earlier) TET2 lesion rank within the clonal hierarchy (greater clonal burden) was associated with impaired survival. Moreover, MDS driven by ancestral TET2MT is likely derived from TET2MT CHIP with a penetrance of ~1%. Following ancestral TET2 mutations, individual disease course is determined by secondary hits. Using multidimensional analyses, we demonstrate how hits following the TET2 founder defect induces phenotypic shifts toward dysplasia, myeloproliferation, or progression to AML. In summary, TET2MT CHIP-derived MDS is a subclass of MDS that is distinct from de novo disease.


Conflict of interest statement

Compliance with ethical standards

Conflict of interest The authors declare that they have no conflict of interest.

Figures

Fig. 1
Fig. 1
Topology and demographics of TET2 mutations in myeloid neoplasms. a Schematic drawing of TET2 gene showing location, distribution, types of mutations, and age-related increases in the number of mutations. For details of mutation and disease subtypes, see Supplementary Fig. 1. b Distribution of number and type of TET2MT across the spectrum TET2MT. c The frequencies of single and multiple mutations in each disease subtype and the distribution of mutant VAF by MDS subtype
Fig. 2
Fig. 2
Clonal architecture of TET2 mutants. a Co-occurring mutations in TET2MT patients. b Frequency of somatic mutations co-occurring with TET2MT. c The average number of mutations of patients without a TET2MT, a single TET2MT, or double TET2MT. d Mutational profiles of TET2MT (solid bars) and TET2WT (hashed bars) within disease subtype
Fig. 3
Fig. 3
Clonal hierarchy of TET2 mutations. a Cross-sectional analysis of patient samples to identify clonal hierarchy of TET2 (second sphere to the left top row represents a patient with three TET2 mutations, including an ancestral and two different subclonal hits). b Distribution of TET2MT patients based on the position of TET2MT within the clonal hierarchy, and the frequency of other mutations throughout the clonal hierarchy. c The average number of mutations of MDS, MPN, and AML patients with ancestral hits of various genes. d Meta-analysis to show the frequency of TET2MT CHIP and CHIP-related MDS. Values above arrows are reverse direction multipliers of percentages of individuals
Fig. 4
Fig. 4
Secondary hits of TET2 mutants. a Associations between disease phenotypes and mutation rates are quantified by the odds ratios, MDS (X) vs. MPN (Y), and high risk vs. low risk (Z). Mutations showing significant enrichment in comparison to patients with only a TET2MT (shown in smaller gray ball) are indicated by color according to OR 95% CI limits. Red color indicates separation of CI in all directions, blue indicates separation in two of the three directions, green indicates separation in a single direction, black indicates no separation. The sizes of the spheres are proportional to the frequency of the mutation in our cohort. The largest white ball is the total cohort of all ancestral TET2MT carriers combined. Tables shown provide odds ratio point estimates for each associated plot. b. Associations between phenotypes and mutation rates are quantified by odds ratios, leukopenia (X), anemia (Y), and thrombocytopenia (Z). c. Associations between phenotypes and mutation rates are quantified by odds ratios, myeloid dysplasia (X), erythroid dysplasia (Y), and megakaryoctye dysplasia (Z). Definitions for classification of dysplasia types and cytopenias are provided in Supplementary Table 2

References

    1. Delhommeau F, Dupont S, Della Valle V, James C, Trannoy S, Masse A, et al. Mutation in TET2 in myeloid cancers. N Eng J Med 2009;360:2289–301. - PubMed
    1. Langemeijer SM, Kuiper RP, Berends M, Knops R, Aslanyan MG, Massop M, et al. Acquired mutations in TET2 are common in myelodysplastic syndromes. Nat Genet 2009;41:838–42. - PubMed
    1. Cazzola M, Della Porta MG, Malcovati L. The genetic basis of myelodysplasia and its clinical relevance. Blood 2013; 122:4021–34. - PMC - PubMed
    1. Quivoron C, Couronne L, Della Valle V, Lopez CK, Plo I, Wagner-Ballon O, et al. TET2 inactivation results in pleiotropic hematopoietic abnormalities in mouse and is a recurrent event during human lymphomagenesis. Cancer Cell 2011;20:25–38. - PubMed
    1. Busque L, Patel JP, Figueroa ME, Vasanthakumar A, Provost S, Hamilou Z, et al. Recurrent somatic TET2 mutations in normal elderly individuals with clonal hematopoiesis. Nat Genet 2012;44:1179–81. - PMC - PubMed

Publication types

MeSH terms