. 2018 May 24;14(5):e1006136.
doi: 10.1371/journal.pcbi.1006136. eCollection 2018 May.

Design of optimal nonlinear network controllers for Alzheimer's disease

Affiliations

Design of optimal nonlinear network controllers for Alzheimer's disease

Lazaro M Sanchez-Rodriguez et al. PLoS Comput Biol. .

Abstract

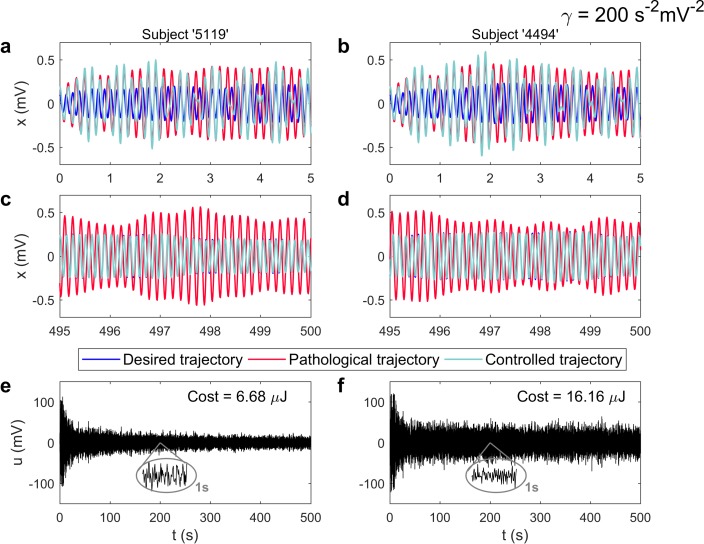
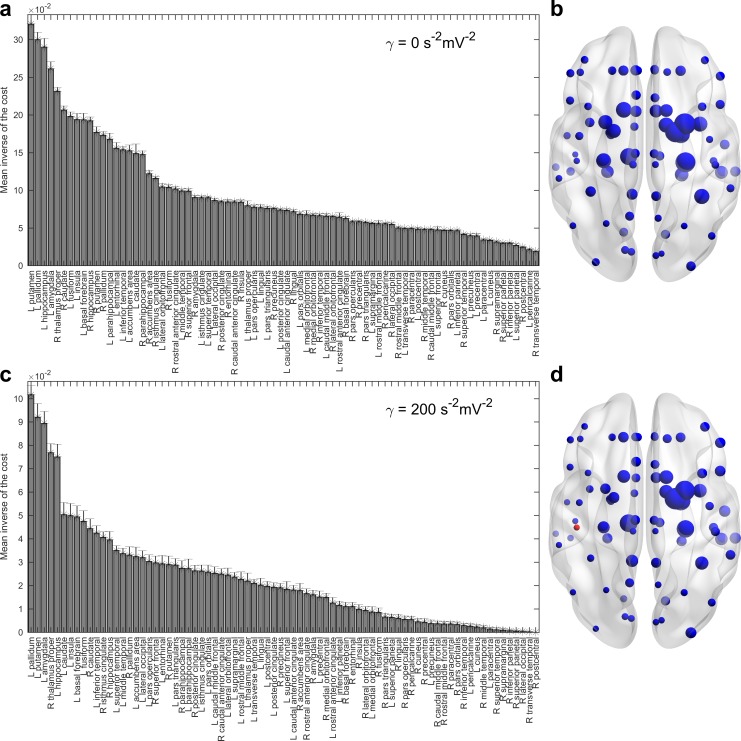
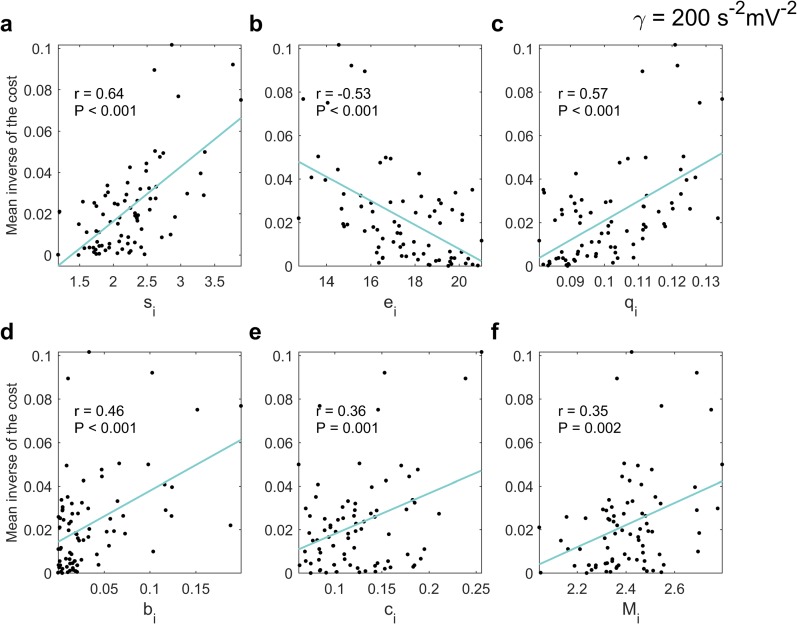
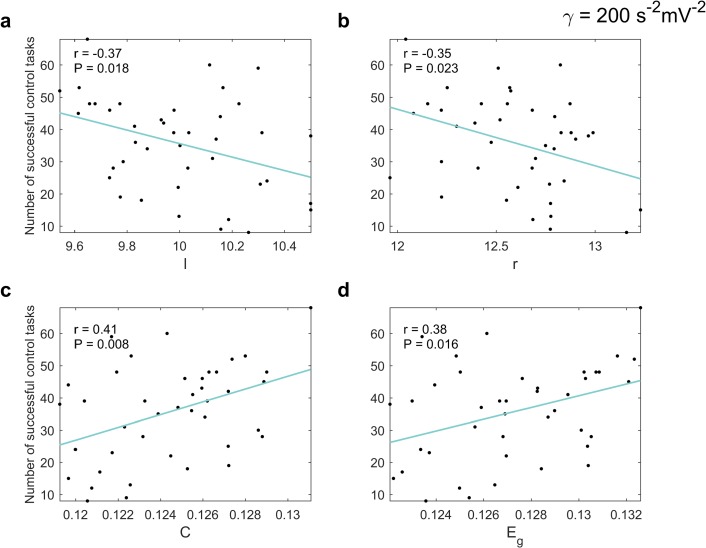
Brain stimulation can modulate the activity of neural circuits impaired by Alzheimer's disease (AD), having promising clinical benefit. However, all individuals with the same condition currently receive identical brain stimulation, with limited theoretical basis for this generic approach. In this study, we introduce a control theory framework for obtaining exogenous signals that revert pathological electroencephalographic activity in AD at a minimal energetic cost, while reflecting patients' biological variability. We used anatomical networks obtained from diffusion magnetic resonance images acquired by the Alzheimer's Disease Neuroimaging Initiative (ADNI) as mediators for the interaction between Duffing oscillators. The nonlinear nature of the brain dynamics is preserved, given that we extend the so-called state-dependent Riccati equation control to reflect the stimulation objective in the high-dimensional neural system. By considering nonlinearities in our model, we identified regions for which control inputs fail to correct abnormal activity. There are changes to the way stimulated regions are ranked in terms of the energetic cost of controlling the entire network, from a linear to a nonlinear approach. We also found that limbic system and basal ganglia structures constitute the top target locations for stimulation in AD. Patients with highly integrated anatomical networks-namely, networks having low average shortest path length, high global efficiency-are the most suitable candidates for the propagation of stimuli and consequent success on the control task. Other diseases associated with alterations in brain dynamics and the self-control mechanisms of the brain can be addressed through our framework.


Conflict of interest statement

The authors have declared that no competing interests exist.

Figures

Fig 1
Fig 1. Optimal nonlinear network control of Alzheimer’s.
a) Anatomical connection density matrices (W) for the interaction of 78 predefined brain regions were obtained for each of the patients in the study. The color code and size of the edges represent the weight of the connections. b) Duffing oscillators describe the activity in each brain region i, and are coupled through W. The parameter γ characterizes the nonlinearity of the system. By tuning α and the initial conditions, z0 = [x0,y0]T, ‘pathological EEG activity’ (high-amplitude theta-band oscillations, f ≈ 6.4 Hz) and ‘healthy EEG activity’ (low-amplitude alpha-band oscillations, f ≈ 8.0 Hz) are obtained. c) A hypothetical ‘controller’ is moved over all the regions. The controller applies the optimal (least energy-consuming) signal that steers the activity to the healthy state, and guarantees the shift of the EEG spectrum towards higher frequencies. Each stimulus depends on the region and patient receiving it through the dynamical system that is solved.
Fig 2
Fig 2. Controlling the Alzheimer’s pathological EEG activity (nonlinear case).
a) Start of the simulations for the ADNI subject identified as ‘5119’. The evolution of the postsynaptic potential over one region is shown only. Others behave analogously. The desired trajectory corresponds to a ‘healthy’ low-amplitude alpha-band oscillation. The model can also produce ‘pathological’ high-amplitude theta-band oscillations. A control signal feeds the left pallidum for reverting the pathological activity. c) By the end of the simulation, the controlled trajectory almost identically matches the healthy state although it was created with the ‘pathological parameters’. This is the effect of the optimal control signal, shown in (e). Panels (b,d,f) present the same analysis for the subject identified as ‘4494’. Other inputs have the same effect over the impaired activity of subjects ‘5119’ and ‘4494’. However, when these signals are placed over the left pallidum, the energetic cost of the control task is minimum–inserted in (e) and (f). A one-second zoom-in window of the control signal at t = 200s is also inserted. The strength of the nonlinearity was set to γ = 200 s−2mV−2. See S1 Fig for equivalent results obtained over linear systems.
Fig 3
Fig 3. Ranking brain regions according to the mean inverse of the cost of controlling the network.
a) Order corresponding to the linear case. Given is the mean ± SEM of N = 41 subjects. Inputs entering regions in the leftmost part of the order control Alzheimer’s activity at a lowest cost. b) Graphical representation with the approximated location of the brain regions. The size of the spheres is directly proportional to the mean values in panel (a). Panels (c,d) are analogous to (a,b) except that the strength of the nonlinearity has been set to γ = 200 s−2mV−2 and a new ranking is obtained. The red sphere represents the right postcentral gyrus, which yielded uncontrollable nonlinear systems for all the subjects in the sample.
Fig 4
Fig 4. Nonlinearity-related changes to the average brain regions’ ranking.
a) Rank correlations between the orders corresponding to different nonlinearities (paired t-test: large-sample approximation, P < 0.001 in all the cases, N = 78 regions). As the nonlinearity increases, the Spearman’s rho coefficients for the correlation between a ranking and both, the order corresponding to the previous nonlinearity and to the linear case, decrease. b) The rankings for the nonlinearities γ = 0 s−2mV−2 and γ = 200 s−2mV−2 are compared. These orders are similar in their top and bottom-most parts (inserted ellipses) and dissimilar in between.
Fig 5
Fig 5. The effect of the local topological measures on the performance of the controllers (nonlinear case).
Relationship between the mean inverse of the cost across the sample and the mean node strength (a) (linear regression: F(1,76) = 55.95, P < 0.001), eccentricity (b) (linear regression: F(1,76) = 29.61, P < 0.001), closeness centrality (c) (linear regression: F(1,76) = 36.94, P < 0.001), betweenness centrality (d) (linear regression: F(1,76) = 20.90, P < 0.001), clustering coefficient (e) (linear regression: F(1,76) = 11.36, P = 0.001) and communicability (f) (linear regression: F(1,76) = 10.87, P = 0.002); N = 78 regions, in all cases. The Pearson correlation coefficients, r, are inserted. The strength of the nonlinearity was set to γ = 200 s−2mV−2. See S2 Fig for equivalent results obtained over linear systems.
Fig 6
Fig 6. The effect of the global topological measures on the success of the control tasks.
Relationship between the number of successful control tasks per subject–the maximum possible value being 78– and the characteristic path length (a) (linear regression: F(1,39) = 6.08, P = 0.018), radius (b) (linear regression: F(1,39) = 5.60, P = 0.023), average clustering coefficient (c) (linear regression: F(1,39) = 7.77, P = 0.008), and global efficiency (d) (linear regression: F(1,39) = 6.39, P = 0.016); N = 41 subjects, in all cases. The Pearson correlation coefficients, r, are inserted. The strength of the nonlinearity was set to γ = 200 s−2mV−2. There are no linear systems-equivalent results as all the stimuli yielded controllable systems in that case.

References

    1. Iturria-Medina Y, Sotero RC, Toussaint PJ, Mateos-Perez JM, Evans AC, Initiative TADN. Early role of vascular dysregulation on late-onset Alzheimer’s disease based on multifactorial data-driven analysis. Nat Commun [Internet]. 2016;7(May):11934 Available from: 10.1038/ncomms11934%255Cnhttp://10.1038/ncomms11934 - DOI - PMC - PubMed
    1. Iturria-Medina Y, Carbonell FM, Sotero RC, Chouinard-Decorte F, Evans AC. Multifactorial causal model of brain (dis)organization and therapeutic intervention: Application to Alzheimer’s disease. Neuroimage [Internet]. 2017;152(February):60–77. Available from: 10.1016/j.neuroimage.2017.02.058 - DOI - PubMed
    1. Hsu W-Y, Ku Y, Zanto TP, Gazzaley A. Effects of noninvasive brain stimulation on cognitive function in healthy aging and Alzheimer’s disease: a systematic review and meta-analysis. Neurobiol Aging [Internet]. 2015;36(8):2348–59. Available from: http://linkinghub.elsevier.com/retrieve/pii/S0197458015002389 10.1016/j.neurobiolaging.2015.04.016 - DOI - PMC - PubMed
    1. Laxton AW, Tang-Wai DF, McAndrews MP, Zumsteg D, Wennberg R, Keren R, et al. A phase I trial of deep brain stimulation of memory circuits in Alzheimer’s disease. Ann Neurol. 2010;68(4):521–34. 10.1002/ana.22089 - DOI - PubMed
    1. Lozano AM, Fosdick L, Chakravarty MM, Leoutsakos J-M, Munro C, Oh E, et al. A Phase II Study of Fornix Deep Brain Stimulation in Mild Alzheimer’s Disease. J Alzheimer’s Dis [Internet]. 2016;54(2):777–87. Available from: http://www.ncbi.nlm.nih.gov/pubmed/27567810%5Cnhttp://www.pubmedcentral.... - PMC - PubMed

Publication types

MeSH terms