

Ancestry-specific recent effective population size in the Americas
- PMID: 29795556
- PMCID: PMC5967706
- DOI: 10.1371/journal.pgen.1007385
Ancestry-specific recent effective population size in the Americas
Abstract
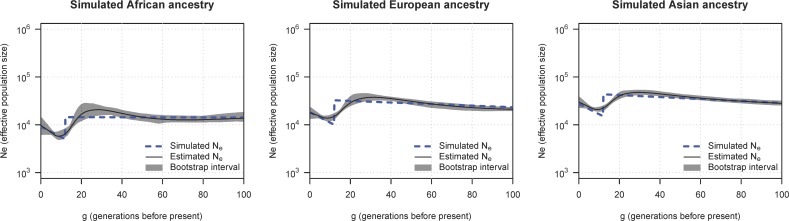
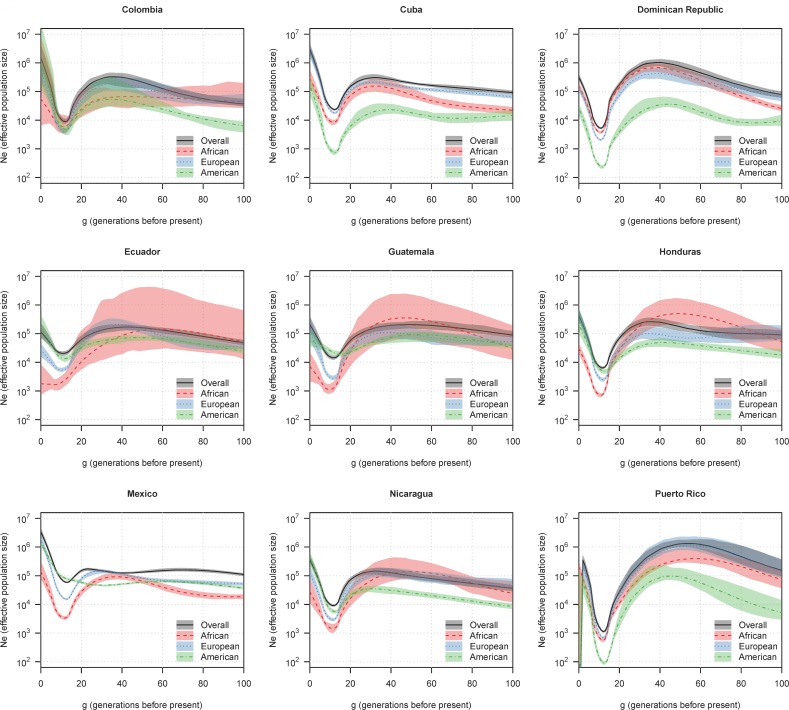
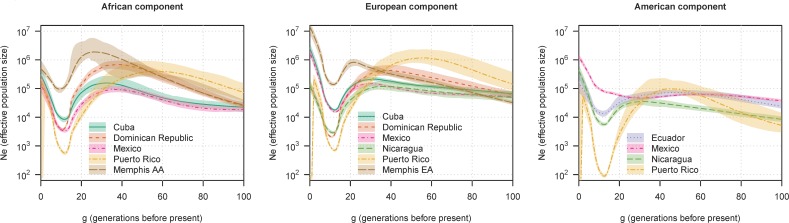
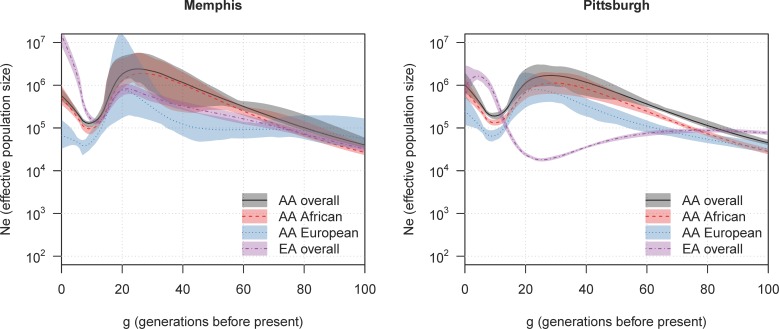
Populations change in size over time due to factors such as population growth, migration, bottleneck events, natural disasters, and disease. The historical effective size of a population affects the power and resolution of genetic association studies. For admixed populations, it is not only the overall effective population size that is of interest, but also the effective sizes of the component ancestral populations. We use identity by descent and local ancestry inferred from genome-wide genetic data to estimate overall and ancestry-specific effective population size during the past hundred generations for nine admixed American populations from the Hispanic Community Health Study/Study of Latinos, and for African-American and European-American populations from two US cities. In these populations, the estimated pre-admixture effective sizes of the ancestral populations vary by sampled population, suggesting that the ancestors of different sampled populations were drawn from different sub-populations. In addition, we estimate that overall effective population sizes dropped substantially in the generations immediately after the commencement of European and African immigration, reaching a minimum around 12 generations ago, but rebounded within a small number of generations afterwards. Of the populations that we considered, the population of individuals originating from Puerto Rico has the smallest bottleneck size of one thousand, while the Pittsburgh African-American population has the largest bottleneck size of two hundred thousand.
Conflict of interest statement
The authors have declared that no competing interests exist.
Figures
References
-
- Henn BM, Botigue LR, Bustamante CD, Clark AG, Gravel S. Estimating the mutation load in human genomes. Nat Rev Genet. 2015;16: 333–43. doi: 10.1038/nrg3931 - DOI - PMC - PubMed
-
- Lim ET, Wurtz P, Havulinna AS, Palta P, Tukiainen T, Rehnstrom K, et al. Distribution and medical impact of loss-of-function variants in the Finnish founder population. Plos Genetics. 2014;10: e1004494 doi: 10.1371/journal.pgen.1004494 - DOI - PMC - PubMed
-
- Keinan A, Clark AG. Recent explosive human population growth has resulted in an excess of rare genetic variants. Science. 2012;336: 740–3. doi: 10.1126/science.1217283 - DOI - PMC - PubMed
-
- Coventry A, Bull-Otterson LM, Liu X, Clark AG, Maxwell TJ, Crosby J, et al. Deep resequencing reveals excess rare recent variants consistent with explosive population growth. Nat Commun. 2010;1: 131 doi: 10.1038/ncomms1130 - DOI - PMC - PubMed
-
- Schultz TP. Human-capital, family-planning, and their effects on population-growth. Am Econ Rev. 1994;84: 255–60.
Publication types
MeSH terms
Grants and funding
- HHSN268201300005C/HL/NHLBI NIH HHS/United States
- N01 HC065233/HL/NHLBI NIH HHS/United States
- N01 HC065236/HL/NHLBI NIH HHS/United States
- R01 DK101855/DK/NIDDK NIH HHS/United States
- U54 TR000123/TR/NCATS NIH HHS/United States
- R01 HG005701/HG/NHGRI NIH HHS/United States
- HG005701 /NH/NIH HHS/United States
- N01 HC065237/HL/NHLBI NIH HHS/United States
- GM099568 /NH/NIH HHS/United States
- N01 HC065235/HL/NHLBI NIH HHS/United States
- P01 GM099568/GM/NIGMS NIH HHS/United States
- P30 DK063491/DK/NIDDK NIH HHS/United States
- N01 HC065234/HL/NHLBI NIH HHS/United States
LinkOut - more resources
Full Text Sources
Other Literature Sources
Miscellaneous
