Multicenter Study
. 2018 May 24;13(5):e0197062.
doi: 10.1371/journal.pone.0197062. eCollection 2018.

A method for age-matched OCT angiography deviation mapping in the assessment of disease- related changes to the radial peripapillary capillaries

Affiliations
Multicenter Study

A method for age-matched OCT angiography deviation mapping in the assessment of disease- related changes to the radial peripapillary capillaries

Alexander Pinhas et al. PLoS One. .

Abstract

Purpose: To present a method for age-matched deviation mapping in the assessment of disease-related changes to the radial peripapillary capillaries (RPCs).

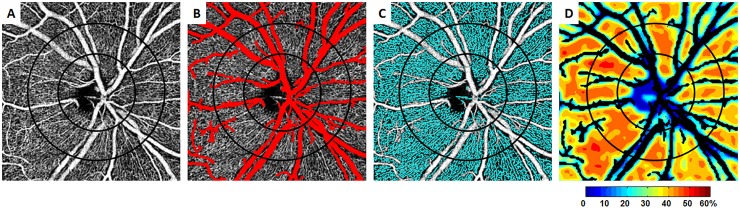
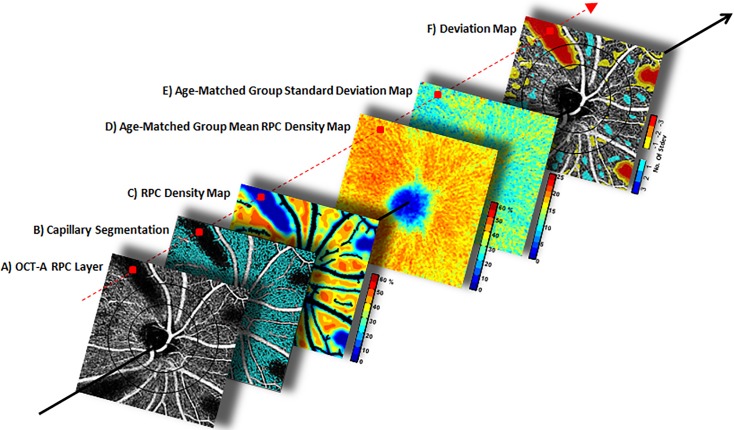
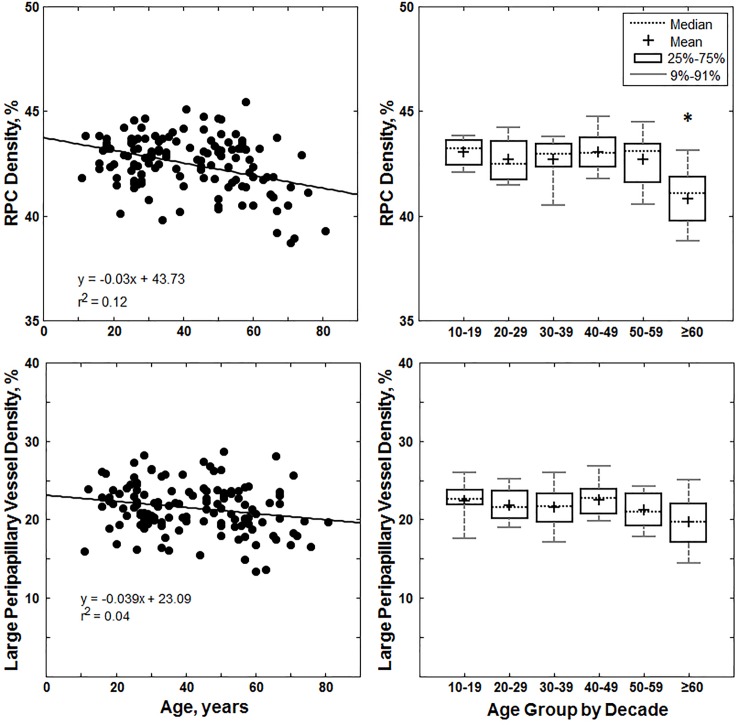
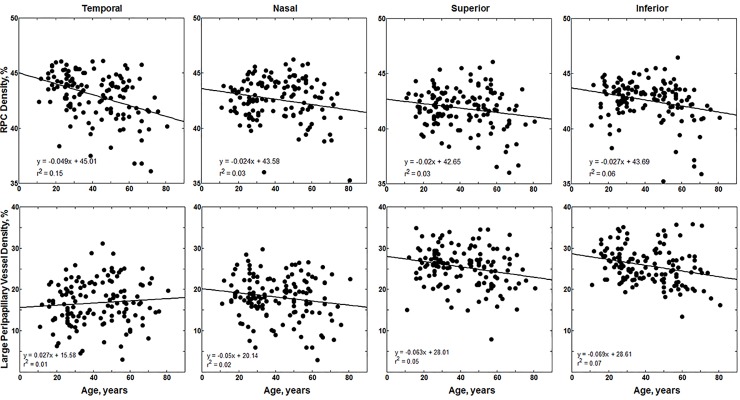
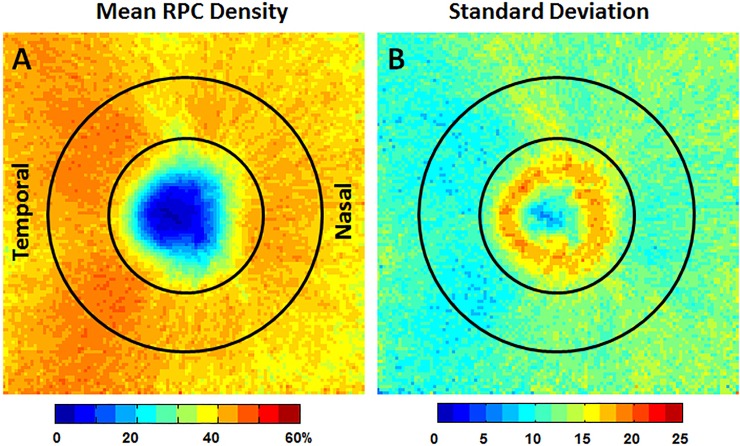
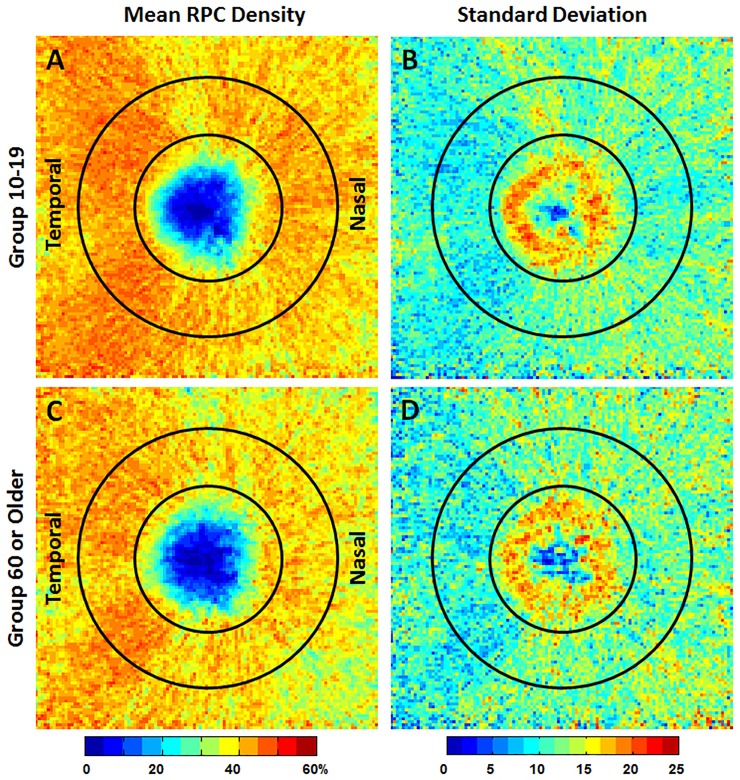
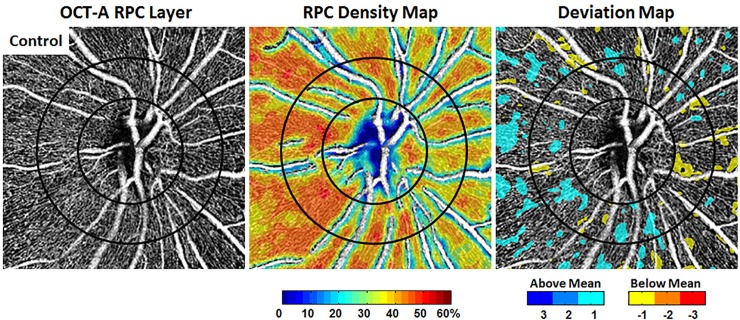
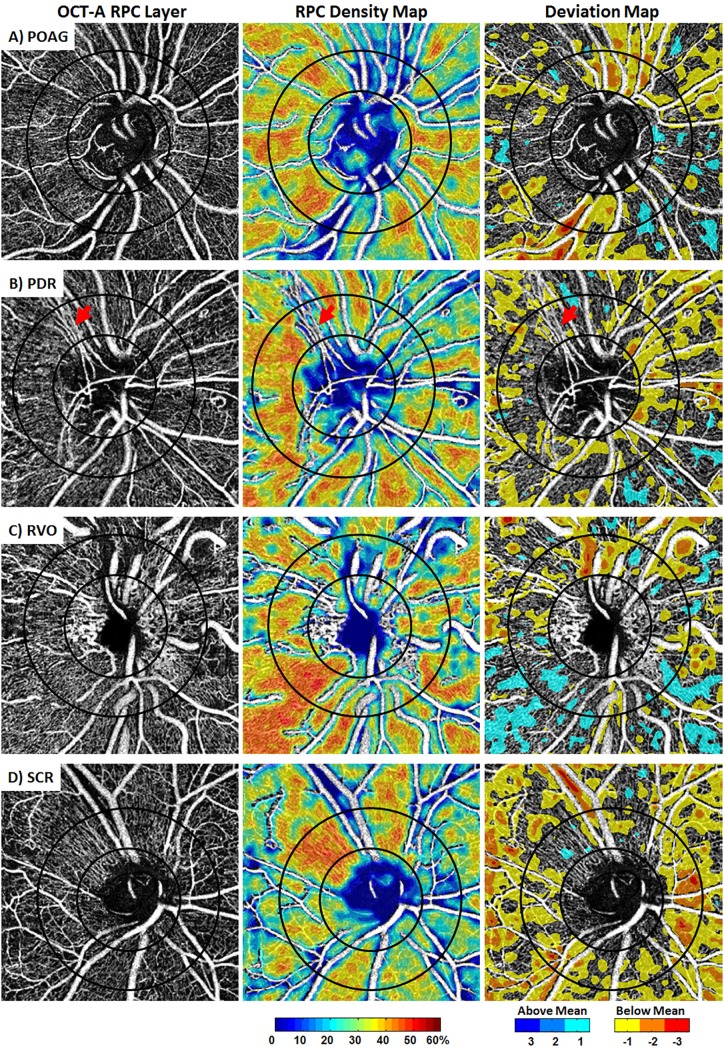
Methods: We reviewed 4.5x4.5mm en face peripapillary OCT-A scans of 133 healthy control eyes (133 subjects, mean 41.5 yrs, range 11-82 yrs) and 4 eyes with distinct retinal pathologies, obtained using spectral-domain optical coherence tomography angiography. Statistical analysis was performed to evaluate the impact of age on RPC perfusion densities. RPC density group mean and standard deviation maps were generated for each decade of life. Deviation maps were created for the diseased eyes based on these maps. Large peripapillary vessel (LPV; noncapillary vessel) perfusion density was also studied for impact of age.

Results: Average healthy RPC density was 42.5±1.47%. ANOVA and pairwise Tukey-Kramer tests showed that RPC density in the ≥60yr group was significantly lower compared to RPC density in all younger decades of life (p<0.01). Average healthy LPV density was 21.5±3.07%. Linear regression models indicated that LPV density decreased with age, however ANOVA and pairwise Tukey-Kramer tests did not reach statistical significance. Deviation mapping enabled us to quantitatively and visually elucidate the significance of RPC density changes in disease.

Conclusions: It is important to consider changes that occur with aging when analyzing RPC and LPV density changes in disease. RPC density, coupled with age-matched deviation mapping techniques, represents a potentially clinically useful method in detecting changes to peripapillary perfusion in disease.


Conflict of interest statement

Dr. Carroll receives financial support from Optovue. Dr. Rosen is a paid consultant for Optovue, Advanced Cellular Technologies, Carl Zeiss Meditech, Clarity, NanoRetina, OD-OS, and Regeneron. Dr. Rosen has personal financial interest in Opticology. These funders have no role in this study’s design, including the collection, analysis, and interpretation of data, writing of the paper, or decision to submit for publication. To the best of our knowledge, these funders have not served and currently do not serve on the editorial board of your journal. These funders have not acted as an expert witness in relevant legal proceedings. This does not alter our adherence to PLOS ONE policies on sharing data and materials.

Figures

Fig 1
Fig 1. Creating an RPC density map for an individual eye.
A) A contrast-stretched 4.5x4.5mm en face peripapillary OCT-A scan at the RPC layer was used. An annular ROI measuring 0.75mm in width was created with two concentric circles centered at the optic nerve head. B) Large peripapillary vessels were extracted, outlined in red. C) Capillaries were segmented, outlined in cyan. D) The resulting RPC density map. Areas involving large peripapillary vessels appear in black.
Fig 2
Fig 2. Deviation mapping methodology explained with simulated capillary defects.
A-C) Creating an RPC density map for the tested eye. D & E) The individual RPC density map was then compared against the age-matched group mean RPC density and SD maps. F) In the deviation maps, cooler colors indicate regions with above group mean densities, and warmer colors below group mean densities. On the scale, darker shades of blue indicate higher densities (cyan indicates 0.5–1.4, light blue indicates 1.5–2.4, and dark blue indicates 2.5 and above). On the other hand, darker shades of red indicate lower densities (yellow indicates 0.5–1.4, orange indicates 1.5–2.4, and red indicates 2.5 and above).
Fig 3
Fig 3
Top row: Linear regression and box plot for annular RPC density versus age for the 133 healthy controls. In the box plot, the asterisk indicates a significant difference in RPC density in the ≥60yr age group compared to that of all the younger age groups. Bottom row: Linear regression and box plot for annular large peripapillary vessel density versus age for the 133 healthy controls.
Fig 4
Fig 4
Top row: Linear regression for RPC density per quadrant versus age for the 133 healthy controls. Bottom row: Linear regression for LPV density per quadrant versus age for the 133 healthy controls.
Fig 5
Fig 5
A) Mean RPC density and B) SD maps for all 133 healthy controls. The relatively lower mean RPC density associated with slightly higher SDs in the superior and inferior regions was due to the presence of periarteriolar capillary-free areas after the removal of large peripapillary vessels. A relatively low RPC density and high SD was observed within the 1.95 mm optic disc margin, suggesting high inter-subject variability of RPC density within the optic disc (Fig 5B). For this reason, RPC density data within the optic disc margin was not used for deviation mapping. The temporal aspect of the optic disc is to the left in all images.
Fig 6
Fig 6
A & C) Group mean RPC density and B & D) SD maps for two different age groups, the 10-19yrs and the ≥60yrs age group. Relatively lower RPC density was observed in the ≥60yrs age group. The temporal aspect of the optic disc is to the left in all images.
Fig 7
Fig 7. RPC density mapping versus deviation mapping on a healthy control eye.
In the deviation map, cooler colors signify number of SDs above the age-matched group mean density for a given locus, and hotter colors signify below. The temporal aspect of the optic disc is to the left in all images.
Fig 8
Fig 8
Individual RPC density mapping vs deviation mapping in A) POAG, B) PDR, C) RVO, D) SCR. Deviation maps highlight the areas with RPC density below or above the age-matched group mean, allowing for the visualization and identification of focal areas of significant change. In the PDR eye, the neovascular vessels emanating from the superior-temporal aspect of the disc have been interpreted by our software as large vessels due to the dilated vessel diameter, and have been removed from the analysis (red arrows). The temporal aspect of the optic disc is to the left in all images.

Similar articles

Cited by

References

    1. Michaelson I. Retinal circulation in man and animals. Thomas; Springfield, III; 1954.
    1. Henkind P. Radial peripapillary capillaries of the retina. I. Anatomy: human and comparative. Br J Ophthalmol. 1967;51(2):115–23. - PMC - PubMed
    1. Henkind P. Symposium on glaucoma: joint meeting with the National Society for the Prevention of Blindness. New observations on the radial peripapillary capillaries. Invest Ophthalmol. 1967;6(2):103–8. - PubMed
    1. Alterman M, Henkind P. Radial peripapillary capillaries of the retina. II. Possible role in Bjerrum scotoma. Br J Ophthalmol. 1968;52(1):26–31. - PMC - PubMed
    1. Kornzweig AL, Eliasoph I, Feldstein M. Selective atrophy of the radial peripapillary capillaries in chronic glaucoma. Arch Ophthalmol. 1968;80(6):696–702. - PubMed

Publication types

MeSH terms