Improving the quality of a collective signal in a consumer EEG headset
- PMID: 29795611
- PMCID: PMC5967739
- DOI: 10.1371/journal.pone.0197597
Improving the quality of a collective signal in a consumer EEG headset
Abstract
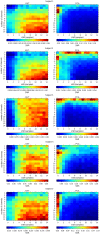
This work focuses on the experimental data analysis of electroencephalography (EEG) data, in which multiple sensors are recording oscillatory voltage time series. The EEG data analyzed in this manuscript has been acquired using a low-cost commercial headset, the Emotiv EPOC+. Our goal is to compare different techniques for the optimal estimation of collective rhythms from EEG data. To this end, a traditional method such as the principal component analysis (PCA) is compared to more recent approaches to extract a collective rhythm from phase-synchronized data. Here, we extend the work by Schwabedal and Kantz (PRL 116, 104101 (2016)) evaluating the performance of the Kosambi-Hilbert torsion (KHT) method to extract a collective rhythm from multivariate oscillatory time series and compare it to results obtained from PCA. The KHT method takes advantage of the singular value decomposition algorithm and accounts for possible phase lags among different time series and allows to focus the analysis on a specific spectral band, optimally amplifying the signal-to-noise ratio of a common rhythm. We evaluate the performance of these methods for two particular sets of data: EEG data recorded with closed eyes and EEG data recorded while observing a screen flickering at 15 Hz. We found an improvement in the signal-to-noise ratio of the collective signal for the KHT over the PCA, particularly when random temporal shifts are added to the channels.
Conflict of interest statement
The authors have declared that no competing interests exist.
Figures


Similar articles
-
Filter bank common spatial patterns in mental workload estimation.Annu Int Conf IEEE Eng Med Biol Soc. 2015;2015:4749-52. doi: 10.1109/EMBC.2015.7319455. Annu Int Conf IEEE Eng Med Biol Soc. 2015. PMID: 26737355
-
Dimensionality reduction for the analysis of brain oscillations.Neuroimage. 2014 Nov 1;101:583-97. doi: 10.1016/j.neuroimage.2014.06.073. Epub 2014 Jul 6. Neuroimage. 2014. PMID: 25003816
-
Applying dimension reduction to EEG data by Principal Component Analysis reduces the quality of its subsequent Independent Component decomposition.Neuroimage. 2018 Jul 15;175:176-187. doi: 10.1016/j.neuroimage.2018.03.016. Epub 2018 Mar 9. Neuroimage. 2018. PMID: 29526744 Free PMC article.
-
[Removal of artifacts from EEG signal].Sheng Wu Yi Xue Gong Cheng Xue Za Zhi. 2008 Apr;25(2):464-7, 471. Sheng Wu Yi Xue Gong Cheng Xue Za Zhi. 2008. PMID: 18610643 Review. Chinese.
-
EEG artifact removal-state-of-the-art and guidelines.J Neural Eng. 2015 Jun;12(3):031001. doi: 10.1088/1741-2560/12/3/031001. Epub 2015 Apr 2. J Neural Eng. 2015. PMID: 25834104 Review.
Cited by
-
Improving Tracking of Selective Attention in Hearing Aid Users: The Role of Noise Reduction and Nonlinearity Compensation.eNeuro. 2025 Feb 19;12(2):ENEURO.0275-24.2025. doi: 10.1523/ENEURO.0275-24.2025. Print 2025 Feb. eNeuro. 2025. PMID: 39880674 Free PMC article.
-
Mobile EEG in research on neurodevelopmental disorders: Opportunities and challenges.Dev Cogn Neurosci. 2019 Apr;36:100635. doi: 10.1016/j.dcn.2019.100635. Epub 2019 Mar 8. Dev Cogn Neurosci. 2019. PMID: 30877927 Free PMC article. Review.
-
Brain-Computer Interface Spellers forCommunication: Why We Need to Address Their Security and Authenticity.Brain Sci. 2020 Mar 2;10(3):139. doi: 10.3390/brainsci10030139. Brain Sci. 2020. PMID: 32121648 Free PMC article.
References
-
- Baillet S, Mosher JC, Leahy RM. Electromagnetic brain mapping. IEEE Signal Processing Magazine. 2001;18(6):14–30. doi: 10.1109/79.962275 - DOI
-
- Logothetis NK. What we can do and what we cannot do with fMRI. Nature. 2008;453(7197):869–878. doi: 10.1038/nature06976 - DOI - PubMed
-
- Baillet S. Magnetoencephalography for brain electrophysiology and imaging. Nat Neurosci. 2017;20(3):327–339. doi: 10.1038/nn.4504 - DOI - PubMed
-
- Tatum WO. Handbook of EEG Interpretation Springer Demos Medic Series. Springer Publishing Company; 2007.
-
- Curran EA, Stokes MJ. Learning to control brain activity: A review of the production and control of EEG components for driving brain—computer interface (BCI) systems. Brain and Cognition. 2003;51(3):326–336. doi: 10.1016/S0278-2626(03)00036-8 - DOI - PubMed
Publication types
MeSH terms
LinkOut - more resources
Full Text Sources
Other Literature Sources

