. 2018 May 24;13(5):e0197934.
doi: 10.1371/journal.pone.0197934. eCollection 2018.

Propofol elicits autophagy via endoplasmic reticulum stress and calcium exchange in C2C12 myoblast cell line

Affiliations

Propofol elicits autophagy via endoplasmic reticulum stress and calcium exchange in C2C12 myoblast cell line

Xi Chen et al. PLoS One. .

Abstract

In this study, we investigated the relationship between propofol and autophagy and examined whether this relationship depends on ER stress, production of ROS (reactive oxygen species), and disruption of calcium (Ca2+) homeostasis. To this end, we measured C2C12 cell apoptosis in vitro, along with Ca2+ levels; ROS production; and expression of proteins and genes associated with autophagy, Ca2+ homeostasis, and ER stress, including LC3 (microtubule-associate protein 1 light chain 3), p62, AMPK (adenosine 5'-monophosphate (AMP)-activated protein kinase), phosphorylated AMPK, mTOR (the mammalian target of rapamycin), phosphorylated mTOR, CHOP (C/BEP homologous protein), and Grp78/Bip (78 kDa glucose-regulated protein). We found that propofol treatment induced autophagy, ER stress, and Ca2+ release. The ratio of phosphorylated AMPK to AMPK increased, whereas the ratio of phosphorylated mTOR to mTOR decreased. Collectively, the data suggested that propofol induced autophagy in vitro through ER stress, resulting in elevated ROS and Ca2+. Additionally, co-administration of an ER stress inhibitor blunted the effect of propofol.


Conflict of interest statement

The authors have declared that no competing interests exist.

Figures

Fig 1
Fig 1. Dual effects of propofol on C2C12 cells.
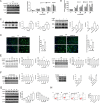
(A) Exposure for 48 h to 25, 50, 100, 150, and 250 μM propofol significantly increased cell count relative to that of the control in a concentration-dependent manner. Each bar represents a mean ± standard deviation (SD); *, P < 0.05; **, P < 0.01, n = 3 per group. (B) Compared to the control, viability was lower in cells incubated for 48 h with 300, 400, 500, 600, 700, 800, and 900 μM propofol. Each bar represents the mean ± SD; *, P < 0.05 vs untreated controls, **, P < 0.01; n = 3 per group. Cell viability was measured by CCK-8 assay. (C) Apoptosis was analyzed and quantified by annexin V/PI staining and flow cytometry. FL1 represents FITC and FL3 represents PI. Data are presented as mean ± SD; **, P < 0.01; n = 3 per group. (D) Production of ROS, as measured by green fluorescence of 2,7-dichlorodihydrofluorescein diacetate (H2-DCFDA). ROS increased significantly in cells treated with 400 μM propofol for 3 h, but decreased significantly in cells treated with 900 μM, as measured by FlowJo. Each bar represents a mean ± SD; **, P < 0.01; n = 3 per group.
Fig 2
Fig 2. Autophagy is induced in propofol-treated C2C12 cells in a concentration-dependent manner.
(A) LC3-II, p62 and Beclin-1 were upregulated in C2C12 cells treated with 50, 100, 200, and 400 μM propofol for 3 h, as measured by western blot. (B) In C2C12 cells treated with 50, 100, 200, and 400 μM propofol for 3 h, p62 and Beclin-1 gene (BCN1) expression increased with propofol concentration, as measured by qRT-PCR. LC3 gene expression also increased, but independently of propofol concentration. Each bar represents a mean ± SD; n = 3; *, P < 0.05 vs untreated controls. (C) LC3-II and p62 were tested in C2C12 cells treated with 0, 5, 10 and 15 μM propofol for 3 h, as measured by western blot. C2C12 cells were treated with 400 μM propofol for 3 h with or without chloroquine (CQ). Expression of LC3 and p62 were detected by western blot analysis. Each bar represents a mean ± SD; *, P < 0.05; **, P < 0.01 vs untreated controls; n = 3 per group; #, P < 0.05 (comparison with cells treated with propofol) (D) Immunofluorescence analysis of LC3 and p62 expression in C2C12 cells treated with or without Propofol (400 μM) for 3 h. Nuclei were stained with Hoechst (scale bar, 50 μM). Fluorescence intensity was calculated and determined for each cell. Each bar represents a mean ± SD; *, P < 0.05; **, P < 0.01; comparison with untreated controls, n = 3 per group. (E) LC3 and p62 were hardly detected in C2C12 cells treated with 50, 100, 200, and 400 μM propofol for 6 h and 24 h, as measured by western blot. (F) Detection of indicated autophagy-essential protein LC3 and p62 by western blot in C2C12 cells with starvation and propofol treatment. LC3 and p62 were not altered in none-starved cells treated with 50, 100, 200, and 400 μM propofol for 3 h, as measured by western blotting. *, P < 0.05; **, P < 0.01 vs untreated controls; n = 3 per group; ##, P < 0.01 (comparison with starvation treated) (G) C2C12 cells treated with 50, 100, 200, and 400 μM propofol for 3 h were analyzed by western blot for phosphorylated AMPK and mTOR. (H) Apoptosis was quantified by flow cytometry. FL1 represents FITC and FL3 represents PI. (a) control; (b) Propofol (400 μM); (c) Propofol (400 μM) + CQ (10 μM); (d) CQ (10 μM). Each bar represents a mean ± SD; *, P < 0.05; **, P < 0.01 comparison with controls; n = 3 per group.
Fig 3
Fig 3. ER stress and calcium homeostasis played key roles in propofol-induced autophagy.
(A) C2C12 cells treated with propofol (400 μM) for 3 h with or without TUDCA (1 mM). CHOP, Bip, LC3, and p62 levels were detected by western blot analysis. The LC3-II/GAPDH and p62/GAPDH ratios increased only in cells exposed to propofol. Each bar represents a mean ± SD; n = 3; *, P < 0.05 vs. untreated controls; **, P < 0.01; ##, p < 0.01 (comparison with cells treated with propofol). (B) C2C12 cells treated with propofol (400 μM), TUDCA (1 mM), or both. Ca2+ was stained by Rhod-2 AM and red fluorescence was induced in control cells and cells treated with propofol for 30 min, 2 h, and 3 h (scale bar, 50 μM). (C) To detect the concentration of Ca2+, Ca2+ was stained by Rhod-2 AM and red fluorescence was induced. The y-axis represents the mean intensity of red fluorescence in each cell; each bar represents a mean ± SD; n = 4; *, P < 0.05 vs untreated controls; ##, p < 0.01 (comparison with cells treated with propofol). (D) IP3R and Beclin-1 expression levels were measured by western blot. CHOP, C/BEP homologous protein; Bip/Grp78, 78 kDa glucose-regulated protein; IP3R, inositol triphosphate receptor.
Fig 4
Fig 4. Propofol induced a burst of ROS.
(A) Production of ROS, as measured by 2,7-dichlorodihydrofluorescein diacetate (H2-DCFDA) (left panels); nuclei were stained with Hoechst (middle panels). In merged images (right panels), the green fluorescence increased in cells treated with 400 μM propofol, but decreased in cells treated with TUDCA. In the quantification of ROS production measured by H2-DCFDA, the y-axis represents the mean intensity of green fluorescence. Data are presented as mean ± SD; *, P < 0.05; n = 3 per group. (B) Production of ROS, as measured by H2-DCFDA; fluorescence-activated cell sorting (FACS) was performed. ROS increased in cells treated with 400 μM propofol but decreased in cells treated with TUDCA. (a) Control; (b) Propofol (400 μM); (c) Propofol (400 μM) + TUDCA (1 mM); (d) TUDCA (1 mM). Y-axis represents cell counts, x-axis represents intensity of green fluorescence. (C) Production of ROS, as measured by H2-DCFDA; FACS was performed. ROS output also decreased in cells treated with 3-MA, alone or in combination with propofol. (a) Control; (b) Propofol (400 μM); (c) Propofol (400 μM) + 3-MA (10 mM); (d) 3-MA (10 mM). Y-axis represents cell counts, x-axis represents intensity of green fluorescence. Data are presented as mean ± SD; *, P < 0.05; n = 3 per group. (D) C2C12 cells were treated with NAC (3 mM) for 3 h, and ROS levels were quantified by flow cytometry. ROS were stained by H2-DCFDA and green fluorescence was induced. ROS production was inhibited by NAC. (a) Control; (b) NAC (3 mM); y-axis represents cell counts, x-axis represents intensity of green fluorescence. (E) Detection of indicated autophagy-essential protein LC3 by western blot in C2C12 cells with co-treatment of NAC and propofol. Each bar represents a mean ± SD; *, P < 0.05; **, P < 0.01; n = 3 per group; ##, p < 0.01 (comparison with cells treated with propofol).

References

    1. Young C, Knudsen N, Hilton A, Reves JG. Sedation in the intensive care unit. Critical care medicine. 2000;28(3):854–66. Epub 2001/02/07. . - PubMed
    1. Wu Q, Zhao Y, Chen X, Zhu M, Miao C. Propofol attenuates BV2 microglia inflammation via NMDA receptor inhibition. Canadian journal of physiology and pharmacology. 2017. Epub 2017/08/18. doi: 10.1139/cjpp-2017-0243 . - DOI - PubMed
    1. Ren G, Zhou Y, Liang G, Yang B, Yang M, King A, et al. General Anesthetics Regulate Autophagy via Modulating the Inositol 1,4,5-Trisphosphate Receptor: Implications for Dual Effects of Cytoprotection and Cytotoxicity. Scientific reports. 2017;7(1):12378 Epub 2017/09/30. doi: 10.1038/s41598-017-11607-0 ; PubMed Central PMCID: PMCPMC5620053. - DOI - PMC - PubMed
    1. Basu S, Mutschler DK, Larsson AO, Kiiski R, Nordgren A, Eriksson MB. Propofol (Diprivan-EDTA) counteracts oxidative injury and deterioration of the arterial oxygen tension during experimental septic shock. Resuscitation. 2001;50(3):341–8. Epub 2001/11/24. . - PubMed
    1. Cui WY, Tian AY, Bai T. Protective effects of propofol on endotoxemia-induced acute kidney injury in rats. Clinical and experimental pharmacology & physiology. 2011;38(11):747–54. Epub 2011/08/10. doi: 10.1111/j.1440-1681.2011.05584.x . - DOI - PubMed

Publication types