

Descriptive Statistics for Modern Test Score Distributions: Skewness, Kurtosis, Discreteness, and Ceiling Effects
- PMID: 29795825
- PMCID: PMC5965643
- DOI: 10.1177/0013164414548576
Descriptive Statistics for Modern Test Score Distributions: Skewness, Kurtosis, Discreteness, and Ceiling Effects
Abstract
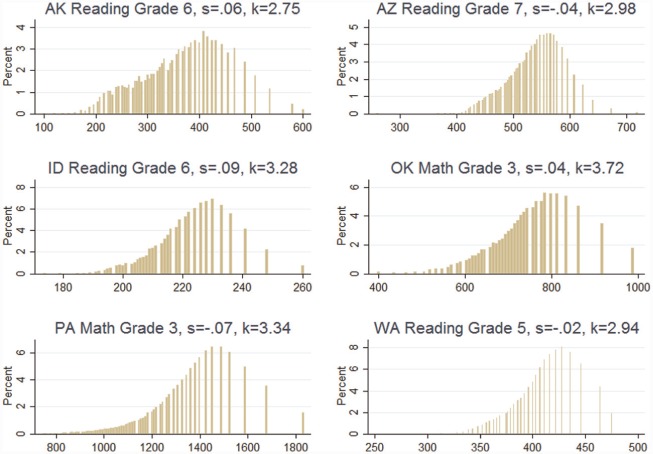
Many statistical analyses benefit from the assumption that unconditional or conditional distributions are continuous and normal. More than 50 years ago in this journal, Lord and Cook chronicled departures from normality in educational tests, and Micerri similarly showed that the normality assumption is met rarely in educational and psychological practice. In this article, the authors extend these previous analyses to state-level educational test score distributions that are an increasingly common target of high-stakes analysis and interpretation. Among 504 scale-score and raw-score distributions from state testing programs from recent years, nonnormal distributions are common and are often associated with particular state programs. The authors explain how scaling procedures from item response theory lead to nonnormal distributions as well as unusual patterns of discreteness. The authors recommend that distributional descriptive statistics be calculated routinely to inform model selection for large-scale test score data, and they illustrate consequences of nonnormality using sensitivity studies that compare baseline results to those from normalized score scales.
Keywords: accountability; descriptive statistics; exploratory data analysis; high-stakes testing; psychometrics.
Conflict of interest statement
Declaration of Conflicting Interests: The author(s) declared no potential conflicts of interest with respect to the research, authorship, and/or publication of this article.
Figures


Similar articles
-
Univariate and multivariate skewness and kurtosis for measuring nonnormality: Prevalence, influence and estimation.Behav Res Methods. 2017 Oct;49(5):1716-1735. doi: 10.3758/s13428-016-0814-1. Behav Res Methods. 2017. PMID: 27752968
-
Effects of skewness and kurtosis on normal-theory based maximum likelihood test statistic in multilevel structural equation modeling.Behav Res Methods. 2011 Dec;43(4):1066-74. doi: 10.3758/s13428-011-0115-7. Behav Res Methods. 2011. PMID: 21671139
-
A comparison of methods of normalizing a discrete distribution.J Clin Psychol. 1982 Jul;38(3):581-7. doi: 10.1002/1097-4679(198207)38:3<581::aid-jclp2270380318>3.0.co;2-5. J Clin Psychol. 1982. PMID: 7107922
-
Testing experimental data for univariate normality.Clin Chim Acta. 2006 Apr;366(1-2):112-29. doi: 10.1016/j.cca.2005.11.007. Epub 2006 Jan 4. Clin Chim Acta. 2006. PMID: 16388793 Review.
-
Fundamentals of Research Data and Variables: The Devil Is in the Details.Anesth Analg. 2017 Oct;125(4):1375-1380. doi: 10.1213/ANE.0000000000002370. Anesth Analg. 2017. PMID: 28787341 Review.
Cited by
-
Overfactoring in rating scale data: A comparison between factor analysis and item response theory.Front Psychol. 2022 Nov 30;13:982137. doi: 10.3389/fpsyg.2022.982137. eCollection 2022. Front Psychol. 2022. PMID: 36533017 Free PMC article.
-
Compas-Y: A mixed methods pilot evaluation of a mobile self-compassion training for people with newly diagnosed cancer.Digit Health. 2023 Oct 19;9:20552076231205272. doi: 10.1177/20552076231205272. eCollection 2023 Jan-Dec. Digit Health. 2023. PMID: 37868157 Free PMC article.
-
Examination of ChatGPT's Performance as a Data Analysis Tool.Educ Psychol Meas. 2025 Jan 3:00131644241302721. doi: 10.1177/00131644241302721. Online ahead of print. Educ Psychol Meas. 2025. PMID: 39759537 Free PMC article.
-
The development and validation of the hospital organizational environment scale for medical staff in China.Front Public Health. 2023 Sep 21;11:1118337. doi: 10.3389/fpubh.2023.1118337. eCollection 2023. Front Public Health. 2023. PMID: 37809008 Free PMC article. Review.
-
Development and psychometric evaluation of the family intensive care units syndrome inventory.Brain Behav. 2023 Jul;13(7):e3101. doi: 10.1002/brb3.3101. Epub 2023 Jun 6. Brain Behav. 2023. PMID: 37279159 Free PMC article. Review.
References
-
- Azzalini A., Capitanio A. (1999). Statistical applications of the multivariate skew normal distribution. Journal of the Royal Statistical Society Series B (Statistical Methodology), 61, 579-602.
-
- Barnett V. (1975). Probability plotting methods and order statistics. Applied Statistics, 24, 95-108.
-
- Betebenner D. W. (2009). Norm- and criterion-referenced student growth. Educational Measurement: Issues and Practice, 28(4), 42-51.
-
- Bollen K. A. (1989). Structural equations with latent variables. New York, NY: Wiley.
-
- Boneau C. A. (1960). The effects of violations of assumptions underlying the t test. Psychological Bulletin, 57, 49-64. - PubMed
LinkOut - more resources
Full Text Sources
Other Literature Sources
Miscellaneous