. 2015 Jun;75(3):428-457.
doi: 10.1177/0013164414546566. Epub 2014 Aug 14.

Type I and Type II Error Rates and Overall Accuracy of the Revised Parallel Analysis Method for Determining the Number of Factors

Affiliations

Type I and Type II Error Rates and Overall Accuracy of the Revised Parallel Analysis Method for Determining the Number of Factors

Samuel B Green et al. Educ Psychol Meas. 2015 Jun.

Abstract

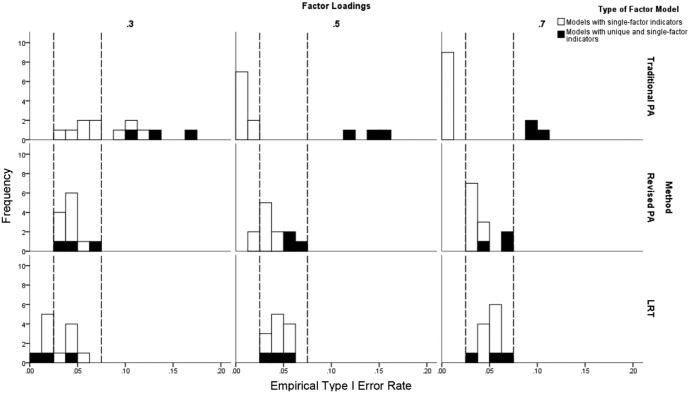
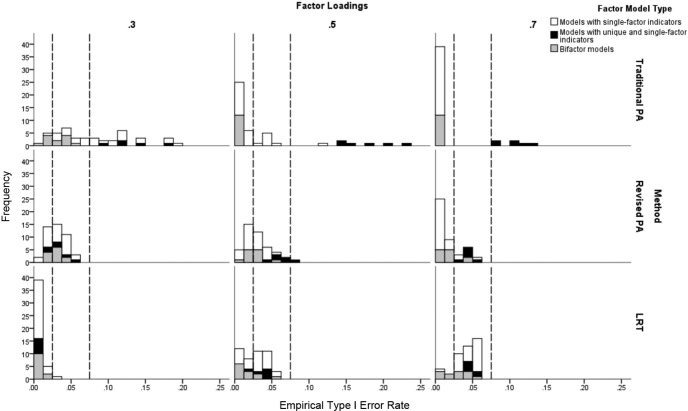
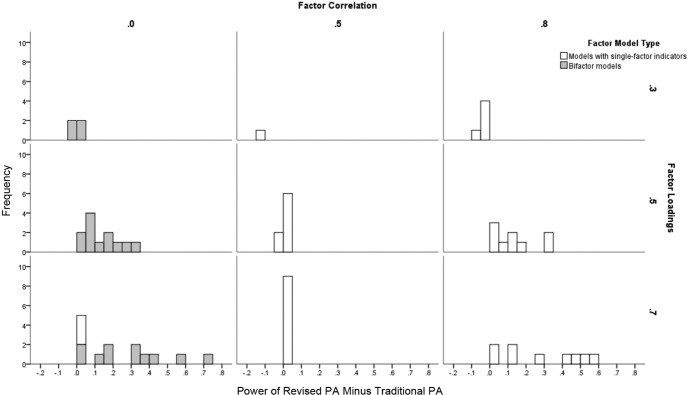
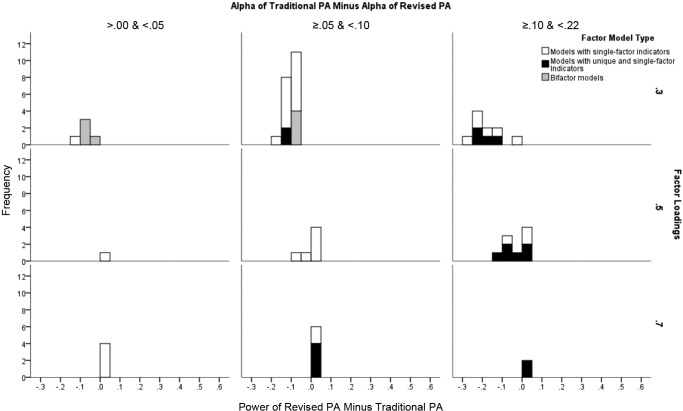
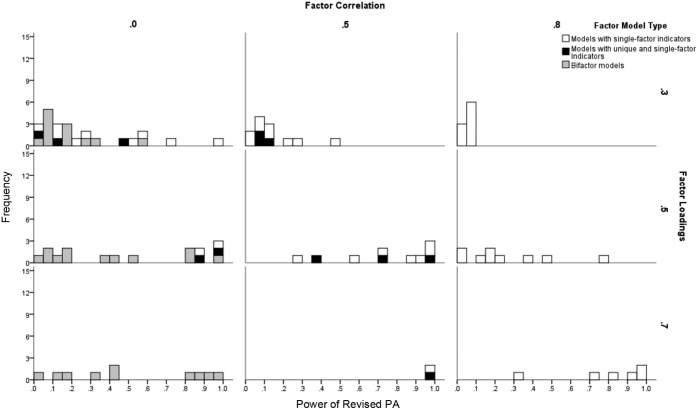
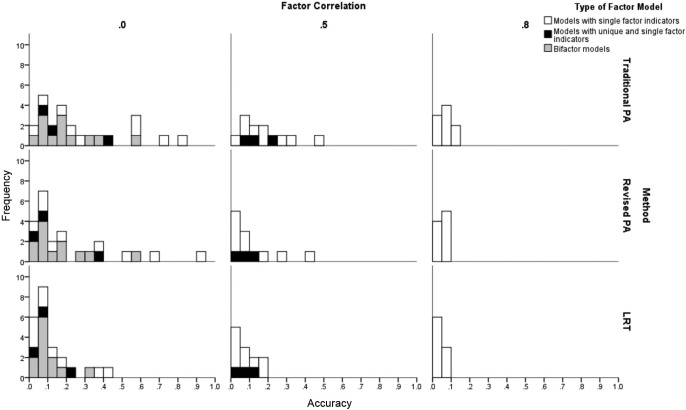
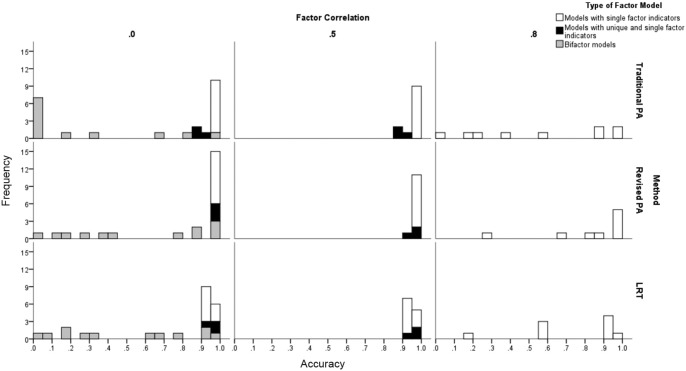
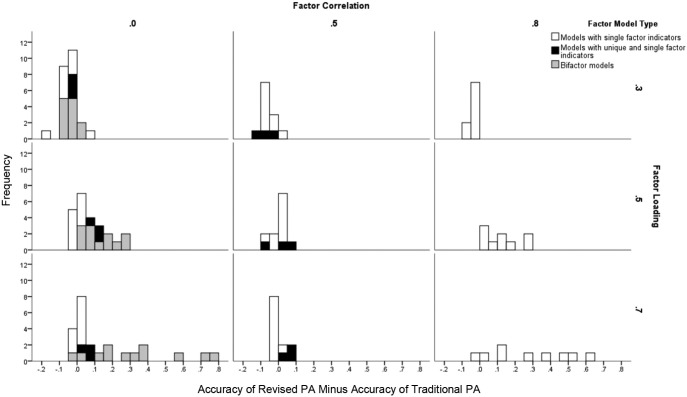
Traditional parallel analysis (T-PA) estimates the number of factors by sequentially comparing sample eigenvalues with eigenvalues for randomly generated data. Revised parallel analysis (R-PA) sequentially compares the kth eigenvalue for sample data to the kth eigenvalue for generated data sets, conditioned on k- 1 underlying factors. T-PA and R-PA are conceptualized as stepwise hypothesis-testing procedures and, thus, are alternatives to sequential likelihood ratio test (LRT) methods. We assessed the accuracy of T-PA, R-PA, and LRT methods using a Monte Carlo approach. Although no method was uniformly more accurate across all 180 conditions, the PA approaches outperformed LRT methods overall. Relative to T-PA, R-PA tended to perform better within the framework of hypothesis testing and to evidence greater accuracy in conditions with higher factor loadings.

Keywords: factor analysis; parallel analysis; revised parallel analysis.


Conflict of interest statement

Declaration of Conflicting Interests: The author(s) declared no potential conflicts of interest with respect to the research, authorship, and/or publication of this article.

Figures

Figure 1.
Figure 1.
Empirical Type I error rates for conditions with models having one factor. The pairs of lines at .025 and .075 represent the lower and upper limits of an acceptable alpha using Bradley’s (1978) liberal criterion.
Figure 2.
Figure 2.
Empirical Type I error rates for conditions with models with two or more factors. For bifactor models, the factor loadings are those for the general factors, not the group factors. The pairs of lines at .025 and .075 represent the lower and upper limits of an acceptable alpha using Bradley’s (1978) liberal criterion.
Figure 3.
Figure 3.
Relative power of revised parallel analysis (R-PA) and traditional parallel analysis (T-PA) to reject the null hypothesis of NF− 1 factors for conditions with two or three factors (NF = 2 or 3) and noninflated alphas (<.075). For bifactor models, the factor loadings are those for the general factors, not the group factors.
Figure 4.
Figure 4.
Relative power of revised parallel analysis (R-PA) and traditional parallel analysis (T-PA) to reject the null hypothesis of NF− 1 factors for conditions with two or three factors and inflated alphas (>.075). For bifactor models, the factor loadings are those for the general factors, not the group factors.
Figure 5.
Figure 5.
Power of the revised parallel analysis (R-PA) method for models with two or more factors.
Figure 6.
Figure 6.
Overall accuracies of revised parallel analysis (R-PA), traditional parallel analysis (T-PA), and likelihood ratio test (LRT) methods for conditions with two or more factors and with factor loadings of .30. For bifactor models, the factor loadings are those for the general factors, not the group factors.
Figure 7.
Figure 7.
Overall accuracies of revised parallel analysis (R-PA), traditional parallel analysis (T-PA), and likelihood ratio test (LRT) methods for conditions with two or more factors and with factor loadings of .70. For bifactor models, the factor loadings are those for the general factors, not the group factors.
Figure 8.
Figure 8.
Relative accuracies of revised parallel analysis (R-PA) and traditional parallel analysis (T-PA) for conditions with two-factor or three-factor models. For bifactor models, the factor loadings are those for the general factors, not the group factors (which were either .3 or .5).

References

    1. Bradley J. V. (1978). Robustness? British Journal of Mathematical and Statistical Psychology, 31, 144-152.
    1. Buja A., Eyuboglu N. (1992). Remarks on parallel analysis. Multivariate Behavioral Research, 27, 509-540. - PubMed
    1. Cattell R. B. (1966). The scree test for the number of factors. Multivariate Behavioral Research, 1, 245-276. - PubMed
    1. Crawford A., Green S. B., Levy R., Lo W.-J., Scott L., Svetina D. S., Thompson M. S. (2010). Evaluation of parallel analysis methods for determining the number of factors. Educational and Psychological Measurement, 70, 885-901.
    1. Dinno A. (2009). Exploring the sensitivity of Horn’s parallel analysis to the distributional form of random data. Multivariate Behavioral Research, 44, 362-388. - PMC - PubMed

LinkOut - more resources